When one turns to the magnificent edifice of the physical sciences, and sees how it was reared; what thousands of disinterested and moral lives of men lie buried in its mere foundations; what patience and postponement, what choking down of preference,… how absolutely impersonal it stands in its vast augustness—then how besotted and contemptible seems every sentimentalist who comes blowing his smoke-wreaths, and pretending to decide things from out of his private dream!
—William James (1897)
When I was young, the continents did not move. Well, the continents were moving, all right, only nobody knew that they were. Geologists said the continents did not move, and that meant that nonscientists could not possibly know otherwise. Then, partly because of data collected in the International Geophysical Year (1957–1958), it was discovered that the continents do move after all. So, as is well known to everyone today, even small children, the continents move. But before this knowledge became an official part of science, nobody could know this.
It is not as though nobody thought that the continents moved before then. Alfred Wegener (1880–1930) in particular had argued from 1915 on for what was then called continental drift or mobilism. His arguments, as we can see now, were cogent and powerful: The geological formations of the continents on east and west sides of the Atlantic Ocean match up just as if they had been torn apart at some time in the past, like two halves of a torn dollar bill. But Wegener did not have a mechanism to explain continental motion. Plate tectonics provided that mechanism: The continents move on currents of molten rock in the underlying mantle. Once the scientific community in charge of this matter had concluded that this is how it all worked, then everyone, even children (including me at the time) could then know it.
Science defines what is socially accepted as knowledge of the natural world, and knowledge itself is not the domain of any individual but of humankind as a whole. We rely on the ears and eyes and brains of countless other human beings (many of them now long dead) in order that we may know about Antarctica, bacteria, or dinosaurs. No one among us could possible gather the mountains of evidence and think through the mountains of theory that support even the most common scientific facts taught to our children in school. We must rely on scientific authority—there is no other way. Science is often portrayed as a body of knowledge that rests solely and solidly on the facts themselves, but the fact is that nearly all the science that any one person knows, including scientists, rests on authority. Fortunately, scientists have created a complex hierarchy of scientific authorities to protect the purity of science. Like all things human, it is not perfect. Nevertheless, this modern priesthood of knowledge does work, and is responsible for the wonders of the modern world.
As a youngster I loved science. I loved dinosaurs, atoms, chemicals, radiation, rockets, the solar system, and the myriad of little stars that appeared around the Pleiades when I looked at them through my small reflector telescope. I loved the certainty of science and the thrill of looking through the veil of appearance directly at the underlying reality. I believed in science. My faith was not shaken when Wegener’s theory of continental drift (as it was then called) went from be- ing false to being true. As I saw it, science had searched for new evidence, had found it, and had done the right thing by changing its mind. My faith in science was unshaken.
Then I ran into Einstein’s theory of relativity. That was something else altogether, for when his theory became true it changed the foundations of physical science it- self. As for so many people, Newton’s laws made perfect sense to me. Like many physicists, I felt the truth of Newton’s laws in my guts every time I rode a merry- go-round. But Einstein’s theory required enormous subtlety even to imagine. I couldn’t imagine it, actually, but I took it on authority that Einstein was right, and tried harder to grasp his vision. Around the time I entered university I was reading one of Einstein’s own introductions for the nonphysicist, The Meaning of Relativity (1950), when I suddenly realized what was holding me back: I kept thinking in Newtonian terms, by gut instinct, so to speak. I kept trying to translate relativity into Newtonian physics—but the translation was impossible. Relativity only made sense if, gut instincts notwithstanding, Newton was wrong.
The scales fell from my eyes, and I began to see what Einstein was saying. When you glimpsed the world through Einstein’s theory, it was obvious that Newton was wrong. But if Newton was wrong—and surely he was, even if he was wrong only by a little bit when it came to everyday objects and speeds—then Newton’s laws had never been proven in the first place. What is proven cannot turn out to be false. My faith in scientific authority was shaken. It seemed to me that even when we think science is looking through the veil of appearances, it may just be looking at another set of appearances. My studies of quantum mechanics over the next few years tended to confirm that opinion. We can never transcend ourselves, so we can never leave appearance entirely behind. There is no such thing as scientific proof. But if there is no scientific proof, how does science get to tell us what we can or cannot know? Searching for the answer to that question led me to a career in the philosophy of science, and eventually to environmental science and this book.
In this chapter we have a look at pure environmental science, or environmental science as such, as philosophers say. If we were studying basketball, for example, basketball as such would be defined by the rules of the game. We would discover in those rules that the very idea of basketball is that of a noncontact sport, for that is what the rules say and what the various sorts of fouls and penalties are designed to create. The rules create the game. Knowing what pure basketball is, we would probably be surprised when we have a look at professional basketball, for it involves lots of contact, with huge players shoving and pushing each other right under the noses of the officials, no fouls called. Actual basketball turns out to be an imperfect realization of pure basketball, with its own special problems, solutions, and (dare I say it?) beauty. The same is true for other human endeavors, and science is no exception.
As we saw in Chapter 5, actual environmental science is science applied to the promotion of environmental health. It is not value neutral; it does not seek truth for the sake of truth; it moralizes; it is trying to reshape human life itself into a form that is better for the environment (where, as noted previously, environment stands for all of nature except humankind and its works). It has, to put it bluntly, many of the properties of the sociopolitical ideologies that have gripped our species periodically. In this context it is important not to take our eye off the ball, as it were. If ever there was a time when we needed pure (or at least purer) environmental science, it is now. Since we cannot find something until we know what we are looking for, we need to get a better idea of just what environmental science would be if it were closer to its ideal form. That is our goal in this chapter. We begin by considering science as such. Like most human enterprises, science evolves and its rules are revised as its practitioners deem necessary. So we will start with a bit of science history.
Some readers may find this chapter rather dry and scholarly, which is not surprising, perhaps, since it deals with my own academic specialty, the philosophy of science. Its main ideas are quite simple, and to many people quite obvious: first, that there is no such thing as scientific proof (as the histories of Wegener and Einstein show us), and second, that science cannot tell us what we ought to do, what is right or wrong, what is ethical—in short, has no authority over values. So if you find yourself bogging down in the scholarly technicalities of this discussion, please jump ahead to Case Study 6 and Theses 7 and 8. One main function of this chapter is to prepare us for Case Study 7, which is an extended study of global warming theory. The importance of the global warming issue for the human species and for the rest of nature is enormous. It is the issue that will define the future of environmentalism and environmental science for generations to come.
There is, however, no way to come to grips with global warming except through the scientific technicalities involved. To a large extent these technicalities can be rendered intelligible to nonspecialists, and that is what I am attempting here. Indeed, it is important that as many ordinary civilians among us do this as possible. I urge all readers to read as much of Case Study 7 as they comfortably can. But I also realize that scientific technicalities simply are not some people’s cup of tea, and they should feel free to jump ahead to Chapter 7, which, by way of preview, is about our sense of the sacredness of nature, which is at least as important as (and much more permanent than) the issue of global warming. It is as if our philosophical expedition has a planned ascent of a substantial mountain peak, the mountain of science that is involved in the issue of global warming, as its centerpiece. Ropes and crampons will be used along with other technical aids, to ensure that those who are really determined can make it to the top. However, those who are not interested in such mountaineering are welcome to sit out this part of the expedition.
6.1 THE RISE AND FALL OF SCIENTIFIC PROOF
Before modern science, anyone who wanted to know what kept the Sun and Moon up in the sky, or how human beings came into existence, or whether people from other cultures were trustworthy, would ask a priest. This was not just a peculiarity of Western Europe, where modern science would first begin to flourish, but a more general phenomenon. As we trace cultures back in time we find that religion and science are not at first distinct. The persons who speak authoritatively about matters of fact are the same ones who speak authoritatively about God or the gods. Starting roughly with Copernicus (1473–1543) and Galileo (1564–1642), science began to assert itself against the authority of religion. These scientists said the Sun, not the Earth, was the center of the universe. Copernicus warily published his theory on his deathbed to avoid repercussions from the Church, but Galileo boldly published his ideas despite the dangers, was arrested on suspicion of heresy, and was confined to house arrest. Matters might have ended there, but on Christmas day of the year Galileo died, Newton (1642–1727) was born. He devised the physics, and with it described the mechanism, that explained how the planets go around the Sun. Thanks to Newton, science won a decisive victory. Over the next two centuries, science went from one stunning success to another in the enterprise of understanding nature.
Gradually, the scientist in lab whites replaced the priest in black robes as the authority on what keeps the Sun and Moon up in the sky, or how human beings came into existence, and whether people from other cultures are trustworthy. Newton thought that scientific knowledge was literally proven, in the fullest sense of the word, as exemplified in mathematics. In mathematics we can prove, for example, that any triangle with sides of equal length (an equilateral triangle) also has angles of equal size. This sort of proof is the strongest possible: We cannot even conceive or imagine a triangle with equal sides that does not have equal angles as well. Newton’s epoch-making system of physics was set out in his book, Philosophiae Naturalis Principia Mathematica (The Mathematical Principles of Natural Philosophy1). Newton presents his new philosophy as though it were pure geometry, as a series of proofs of theorems from basic axioms.2 Newton’s famous three laws are presented by him as axioms, or self-evident truths, not as the result of observation or measurement. That is not only different from what scientists are now taught, but opposed to it.
David Hume (1711–1776) showed by a series of ingenious arguments that no universal claims about nature, such as Newton’s laws, could ever be proven. One way to see this is to observe that even though every massive body that we see attracts other masses via gravitation, this does not prove that those we do not see also attract each other.3 Science, in other words, involves its own species of faith: faith in the uniformity of nature. Science demands that we believe that the things which we do not see are precisely like those that we do see. But faith is not proof. For a century or so Hume’s arguments were ignored by scientists as they extended Newton’s scientific foundations to include chemistry, electricity, electromagnetism, and biology. Ernst Mach4 (1838–1916) was, however, a notable exception. Mach took Hume’s problem very seriously, so seriously that he analyzed physics methodically to identify its articles of faith. Two of the articles of faith he discovered were absolute space and absolute time. His most famous student, Albert Einstein (1879–1955), went on to develop a new physics that rejected the Newtonian metaphysical concepts of absolute space and time in favor of relativistic space and time. As we all know, Einstein’s theory of relativity was an absolute success, with countless confirmations by observation. Perhaps the most stunning confirmation is the nuclear explosion, which confirms the equivalence of mass and energy denoted by his famous equation E = mc².
What we do not usually realize—indeed what we do not like to admit—is that Einstein’s physics disproved Newton’s. It also proved, therefore, that science is fallible. Science not only makes small superficial mistakes, but also big foundational mistakes about the fundamental nature of space, time, matter, and energy. Ironically, just as scientists abandoned the idea of scientific proof in the last century, society at large simultaneously embraced the notion as they increasingly turned toward science and away from religion and tradition for knowledge and understanding. Thus, we now find ourselves in an age when the concept of scientific proof is still accepted by people in general, even though scientists themselves gave up on this idea early in the twentieth century—at least officially.
6.2 THE RISE OF MODELING
The assimilation of this historical lesson is very clearly manifested in the view, which is nearly universal among scientists today, that the business of science is to model natural phenomena. A model is an abstract representational structure, typically constructed in mathematical terms, that is sufficiently accurate to enable us to predict and possibly control the phenomenon it represents. We are all familiar with model airplanes, model automobiles, and model ships. Like these models, scientific models include representations of the specific properties of the things modeled, but unlike them they are not physical objects themselves, but abstract structures. For example, a mathematical formula may model an orbit, a pendulum, or soil erosion. Just as a model airplane will not have all of the properties of a real airplane (its tires may not be made of rubber, its motor may not work, it may not fly), so, too, a scientific model will—in fact, must—omit some of the properties of the system. The volume of an orbiting object may be omitted so it can be represented as a point mass, friction may be omitted in the pendulum, no location may be given in a model of eroding soil, and so on. Simplification is of the essence in modeling: The right things must be left out so that the essential things can be included.
The general use by scientists of the concept of modeling to describe their work is an extremely important indicator of a big shift in thinking in the scientific community since the time of Newton: The product of science is not the universal law, but models of aspects of parts of reality (such as the crystalline aspect of salt). Fortunately, maps are a familiar type of model and can be used to illustrate two important points. First, like maps, models are neither proven nor disproven. Instead, they are useful or useless, detailed or simple, accurate or inaccurate. Second, like maps, models require simplification in order to be constructed in the first place. Just as no one expects to find actual houses on a street map, or actual water in a map of the Pacific Ocean, so scientists do not expect their models to capture every aspect of the things they model. The purpose of a model is the same as the purpose of a map: to help us find our way around. What information is contained in a map—and what is left out—depends on what bit of the world we want to navigate. The water department’s map of the same streets as those shown in the driver’s road map will show where the water mains are located, whereas the politician’s map will show the electoral districts instead. In the same way, different sorts of scientists provide different sorts of models, employing different sorts of abstraction, to serve their different sorts of interests. The geologist’s models will ignore fauna and flora to show the rock formations; the biologist’s model will ignore the rock formations to show the fauna and flora.
Scientists’ self-conscious recognition of what they are doing is reinforced by the use of computer models. No one expects that a computer model of photosynthesis will yield any actual carbohydrates or that a meteorological model of a thunderstorm will get anybody wet.5 Notable in the context of environmental science is the fact that much of the belief that we are in the midst of an environmental crisis depends on computer models. The case for the sixth extinction relies on such models. The belief that the Earth is warming dangerously because of carbon dioxide produced by human beings relies on massively complex computer models known as general circulation models (GCMs). GCMs involve a simplification that is striking: In order to model climate, weather is ignored! Because the amount of physical detail involved in global weather is far too great to be handled even by present-day computers, GCM modelers are forced to ignore it in order to model climate by attending primarily to radiation balance (the balance of incoming solar radiation with outgoing infrared radiation). Although no condensation and fall of rain is modeled, the average amount of rainfall may be modeled; although no hurricane is modeled, the average number of hurricanes may be modeled; and so on. It is just plain obvious, then, that GCMs are abstractions, well and truly divorced from full reality. This important issue is discussed more fully in Case Study 7.
6.3 MODELS AND TRUTH
If there is no such thing as scientific proof, must we abandon the entire idea of scientific truth as well? Does science tell us the truth? Does it even make sense to think of science as seeking the truth?
The question is complex, and the answer is not simple. Certainly, we do not have to abandon the entire idea of truth. The concepts of truth and falsehood still apply to such simple claims as “DNA is a molecule,” “dinosaurs are extinct,” and “the water is boiling.” However, the concepts of truth and falsehood are far too simple to apply to entire scientific models. Like maps, models say a lot of things, and it is very crude to think of them as simply true or false. The simple claim that Main Street intersects Central Avenue may, for instance, be true. If the map shows Main intersecting Central, we may say that it contains this truth. But when it comes to the map as a whole, truth and falsehood are very blunt instruments of evaluation. We never say that a map is true or that it is false. Instead, we evaluate maps in terms of their accuracy, precision, completeness, clarity, and so on. For the same reasons, scientists judge their models in just such terms.
Still, a scientist will sometimes speak about theories being true—particularly in the context of public debate—and since theories really are just models, the scientist is in effect saying that a model is true. In a debate with a creationist, a biologist will say that the theory of evolution is true, not that it is a model which is accurate or complete or anything like that. For dramatic effect, he or she may even say that the theory has been proven, so it really is not a theory any more, but a fact. This sort of claim by a scientist is most generously interpreted as rhetorical overstatement. Taken literally it is deeply unscientific. Presumably it is not meant to be taken literally but as a way of emphasizing that the evolutionary model is so accurate, so precise, so complete, that we should just accept it and move on.
Ironically, this nonliteral, nonscientific use of the concept of truth is very close to the popular conception—or misconception. We nonscientists want a simple thumbs- up or thumbs-down when it comes to what we should think or believe. If, for example, after hearing all of the arguments pro and con we decide to accept the evolutionary model, we will say that it is true. If we decide to reject it, we will call it false. It is a busy world, and we do not always have time for subtleties. When we need to know, we need to know now: true or false? So we should not be surprised, then, when scientists give us a yes-or-no answer when we ask them whether a given theory is true. Still, we owe it to ourselves to remember that true-or-false is a simplification—a big simplification. Sometimes we would do ourselves a favor by taking the time to really know the model in question. In science, as in personal relations, it is wise to devote time and sensitivity if we want to achieve something lasting and truly valuable.
In practice, therefore, truth is achieved by constructing a good model, and the pursuit of truth is the pursuit of good models. Five criteria generally apply to models and provide a basis for their evaluation:
- Precision. What, exactly, does the model say? The model cannot be checked for accuracy until what it says is plain. For example, a model which predicts that a flock of ducks will migrate south in the fall is less precise than one that predicts the specific day on which it will head south. Other things being equal, we want greater precision. We want to predict not just the season, but the very day, indeed the very second, something will happen. So precision is very valuable in scientific models. In fact, precision is one of the defining characteristics of science itself.
- Accuracy. How closely does the model match observation? The distinction between precision and accuracy is not obvious and requires a little care if it is to be understood. Precision may be thought of as the target that a model sets for itself. A more precise model sets a smaller target. Accuracy concerns whether or not it hits that target when it comes to observation and measurement. A very precise model of your weight, for instance, would predict your weight to a tiny fraction of an ounce—but that would make it more difficult for the model to be accurate. The demand for precision is what makes the demand for accuracy so difficult. Precision and accuracy are thus in tension with each other—a creative tension, but tension nevertheless.
- Consistency with other successful models. Since successful models are such only because they are precise and accurate, a new model that yields new observations immediately finds itself in danger of being ruled out by well-established observation. Note that the consistency in question is empirical consistency. New models do not have to agree with established models on a theoretical level. Einstein’s model, for example, disagreed profoundly with Newtonian models on a theoretical level. What is essential is that new models agree with well-established observation and measurement.6 Other things being equal, we would prefer a model to be at least as precise and accurate as other models where they deal with the same empirical content.
- Scope. The broader the scope of a model, the better the model, other things being equal. If one map covers more ground than another, it is better in that regard. The broader the scope, the more things it applies to, and the more information it provides us about the world. So we prefer theories with broader scope to those with narrower scope.
- Simplicity. The point of scientific theories is to reduce the booming, buzzing complexity of the world, and to find the simpler patterns underlying the eternally new and rich variety of the unfolding universe, so that we can anticipate events and gain some control over our own destiny. If a theory were just as complex as the world itself, it would be of no use to us. Theories must help us understand the world, and this requires that they be simpler in themselves than the world is in itself. Simplicity is often in tension with accuracy or with scope. For example, classical mechanics is simpler than quantum mechanics, but classical mechanics also has less scope, since it does not include subatomic phenomena and is less accurate, since it asserts that atoms will collapse. We would most like a theory that is both simple in itself and broad in scope, but often we must surrender one of these theoretical virtues in exchange for the other.
- Outcompeting the alternatives. Since there is no absolute measure of scientific merit, we must rely on comparative measures. Therefore, the levels of precision, accuracy, consistency with other models, and scope that a model must obtain in order to be accepted by the scientific community depend on the levels obtained by other models in the same domain.
What these criteria presuppose is that scientific evaluation and judgment are relative. There are no answers to be found in the back of some great textbook in the sky, no angelic referee to tell us what is really true. We must instead do the best with what we have come up with on our own. So scientific models are not measured against the world itself, despite the countless idealizations of science which give that impression. Instead, models are checked against every relevant thing that we know and observe, however imperfectly, and that includes other scientific models. How much accuracy, precision, scope, or simplicity we demand is a function of how much accuracy, precision, scope, or simplicity is already achieved by other models in the same field. This relativity of scientific judgment must be kept in mind whenever we need to figure out just what to make of some new scientific claim. We must also remember that these theoretical virtues are in tension with each other, so that the choice of a theory is not a simple maximization problem, but a multiple-constraint problem.
6.4 PROTECTING SCIENCE’S VALUE NEUTRALITY
One fact that science must face in its maturity is that there is no methodological guarantee that it will not be influenced by factors that are extraneous to its goals. Put plainly, science is not immune to prejudice, where “prejudice” is understood in its literal sense: judgment in advance of, or independently of, the relevant evidence. There is always the logical and methodological possibility within science of its claims to truth (keeping in mind that “truth” is a simplification) being influenced by (or being a partial function of) factors that have no bearing on whether or not the claim is true (precise, accurate, etc.). These factors may include such things as beliefs, values, hunches, inclinations, likes, dislikes, and so on, and they are logically irrelevant in two ways: (1) they neither increase nor decrease the probability that the fact claim is true, and (2) they operate tacitly, unseen beneath the surface of scientific debate.
For example, imagine that a scientist who is a snake specialist (herpetologist) has a deep fear of snakes, due to a now-forgotten childhood incident in which he was horribly frightened by a snake that crawled into his bed. Because of this fear, the scientist is now inclined to accept the higher published ranges of the toxicity of snake venom of a given snake rather than the lower ones, a judgment that might then influence other judgments and inferences. His fear (1) has no bearing on the actual toxicity of the venom, only on his judgment about its toxicity, and (2) he has no idea that his judgment is being influenced in this way.
Scientists and philosophers have been reluctantly forced to admit that there is no logical principle or methodological dictum that does, or would, or could, immunize science against prejudice. To repeat, there is no such thing as scientific proof. That means that there is a logical gap between scientific evidence and scientific doctrine: Evidence does not entail doctrine. As a matter of methodological necessity, then, scientists must, and do, cross that gap by nonlogical means. Scientists must make a leap of faith, and that is where prejudice gets its toehold.
Ron Giere, one of the most prominent contemporary philosophers of science, put the matter bluntly in a book he published in the last year of the twentieth century: “In sum, there is little in current philosophical theories of science that supports the widespread opinion that gender bias is impossible within the legitimate practice of science” (Giere 1999, p. 212). Although Giere speaks here about gender bias, the context makes clear that different sorts of bias may affect science. Science is human through and through. It is not magical; it is not infallible; it is not perfect. There is no logical or methodological prophylaxis against prejudice.
The reaction of philosophers to this dawning realization has ranged from cynicism to idealism, and from activism to complacency.7 Nonacademic, nonscientific men and women are also aware that science changes its mind, and so feel freer to pick and choose scientific theories on the basis of their own personal views and convictions. For instance, many environmentalists think it is perfectly legitimate to accept the theory that our use of fossil fuels is causing global warming not because of its scientific merit, but because they had long before come to see the automobile as ugly, polluting, a blight on cities, and a corrupter of nature. Of course, people do have every right to make up their minds as they please, but the idea that truth is a matter of free choice is not only false but dangerous.
It is crucial at this historical juncture to rediscover the ideals that originally motivated the rise of science and inspired the Enlightenment, for they still apply. The absence of scientific proof or any logic or method to make science immune to prejudice is not a reason to abandon the battle against prejudice and the struggle for truth. To the contrary, it is reason to rejoin the battle with renewed energy and fight for pure science: seeking the truth and nothing but the truth, respecting the evidence, and guarding value neutrality. Science is arguably the most important intellectual achievement of the human species. Value neutrality is essential to science, and at this point in history where humankind prepares to shoulder its responsibilities for nature, science is needed. So value neutrality must be safeguarded and promoted. There is no special test for value neutrality that works with 100% reliability, but that does not mean that value neutrality should be abandoned as a hopeless cause. We must not throw out the baby with the bathwater. We, along with the scientific community, must demand value neutrality of its members, set a high value on it, and take steps to safeguard it.
What steps? We can begin by recognizing that science is in the business of creating models, and that these models are to be judged in terms of the criteria outlined above. Given the relativity of scientific judgment, we must encourage competition among scientific models. Just as evolutionary competition improves the fitness of organisms, so scientific competition improves the fitness of models. And just as evolutionary competition requires biodiversity, so scientific competition requires diversity among its models. So we must encourage scientific pluralism: the creation and development of a variety of competing models in every domain.
One unfortunate effect of science having assumed the social role of defining knowledge is that it has taken on the same authoritarianism that it battled against in its early days. This is quite understandable. Since science says what is to be taught in the schools and universities, what medicines we are to use, and what evidence is permissible in a court of law, it has been pressed to speak with a single voice. It has been pressured to create and maintain scientific orthodoxy. Understandable as this is, it has had some unhealthy results.
Because there is no formal process within science to decide which models to use and which to reject, it has instead come to rely upon informal “consensus,” as it is often called, to determine what is to count as scientific truth. This consensus is the product of historical accident, and wide open to prejudice. Whenever the concept of scientific consensus arises, we must remind ourselves that science has no formal procedure for establishing this consensus. No votes are ever taken, and scientific opinion is never measured. We must remind ourselves that science is not democratic. Its decision procedure—insofar as it has one—is not one person, one vote, but authoritarian: those in charge call the shots. Who is in charge? Scientific authorities emerge from the struggle to publish results, to get research funding, to get on editorial boards that control what gets published and on the committees that control research funding, to write the textbooks, to control the awarding of degrees, and so on—completely without procedural or substantive protocols. It is scientific charisma, as much as anything else, that determines scientific doctrine.
This process has worked surprisingly well. It is far from ideal, but the very idea of changing it would take us into territories and mire us in battles that this brief book cannot afford. We can, however, take some steps to make the best of the current state of play within science.
- Adopt a more mature view of science, one that accepts its fallibility as well as recognizes its achievements. Stop expecting science to determine the truth once and for all by proclamation. Expect scientific debate and more nuanced results.
- Safeguard and protect scientific value neutrality. Truth must be the first and last goal. Be wary of scientific programs and models that have commitments to values other than truth.
- Encourage competition among scientific models. Strong competition is needed if strong models are to evolve.
6.5 THE VALUE NEUTRALITY OF ENVIRONMENTAL SCIENCE
As we have seen, actual environmental science is applied science, not pure science. Its practitioners have the goal of bringing the planet to environmental health, which clearly cannot be done without some image of this target. Not being pure scientists, hence not being bound by value neutrality, they have indeed developed various images of environmental flourishing which converge on the concept of the pristine environment, the environment unaffected by human presence, the wilderness. Pure environmental science, by contrast, is value neutral and does not propound values or let its judgment be influenced by them.
We know as a simple matter of logic that every goal presupposes a value, and that no value is a matter of fact. Science deals with facts, makes no value claims (exercises topical value neutrality), and guards the value neutrality of its judgments (exercises methodological value neutrality). It follows, therefore, that pure environ- mental science cannot define environmental health, since health is evaluative. Health is an ideal, a goal that we set up for ourselves or others. This is not to say that environmental science has nothing at all to say about environmental health, because it will be the source and repository of the knowledge that is relevant both to our concept of environmental health and to the methods we choose to obtain it. Science is tasked with determining the facts, and we look to it to tell us the facts. However, its authority does not extend past the facts. When it comes to deciding what we should aim at, we have gone past the facts and into the realm of values.

William Ruddiman (2003) proposed that human beings began to cause global warm- ing some 8000 years ago, and have thereby forestalled the beginning of the coming ice age. Evidence indicates what he calls an “anomalous” rise in atmospheric carbon dioxide levels, which he argues was caused by human beings clearing forests to grow crops and raise livestock. Then methane levels began to rise 3000 years ago, which he attributes to humans flooding fields to grow rice. Carbon dioxide and methane are both greenhouse gases, and so would cause warming, which Ruddiman suggests was sufficient to forestall the next ice age. According to the generally accepted Milankovitch orbital forcing theory, the cooling that began about 5000 years ago should have continued, and we should now be on our way into the next ice. But, argues Ruddiman, our production of greenhouse gases has delayed this natural cooling.
A Thought Experiment. It should go without saying that the fate of a scientific hypothesis often does not run smooth,8 but let us, for the sake of argument, just suppose that Ruddiman’s theory is right. Let us imagine that we did cause global warming and thereby have delayed the onset of the next ice age, just as he proposes. Suppose further that environmental science (ES) reveals that we can prevent the coming ice age by keeping our release of greenhouse gases at about the same level it is today, with slight increases to counterbalance the increases in Milankovitch cooling over the coming millennia. If the ice age is prevented, Earth keeps the same sort of climate and the same sort of ecosystem that it has enjoyed over the last 6000 years. If the ice age is permitted, we will have the same sort of climate as during the last ice age and the same ecosystem shrinkage and drying as in the last one (see Figure 4.1). Under these circumstances, can ES tell us whether we should prevent the coming ice age?
Yes: Only ES can provide us with the relevant data. What happens to the environment in an ice age? We need to know or we cannot decide what to do, and once ES tells us, we can decide. So obviously, environmental science calls the shots here.
No: But according to our supposition, environmental science has already told us the relevant facts. We know what happens to the environment in an ice age: the same thing that happened last time. Temperate species are pushed south, compressed into a narrower band around the globe, the tropics cool, things become much drier, and so on.
Yes: It is not a simply matter of the facts. We also need to know whether the environment is healthier in an ice age or healthier without one.
No: Suppose that environmental science says it is healthier for the environment if we have the ice age. Even if we grant this, it does not follow that we should let the glaciers march in. That would only follow if we also grant that we ought to optimize environmental health. Without the assumption that environmental health is paramount, we are free to act on other values, such as keeping the current temperate ecosystems thriving or keeping the human species healthy and happy. More to the point, we do not have to grant that the environment is healthier with the ice age. Health is nothing other than the state that living systems should be in. It is therefore a matter of value, not fact.
Yes: We need environmental science to tell us whether meddling with ice ages will cause a worse disaster down the road.
No: We have already supposed that science has provided the relevant facts and that no disaster happens later. The point of this thought experiment is to fix the facts so that we can address questions of value without confusing them with matters of fact. We agree that science is responsible for informing us about the facts, both what will happen and what would happen under different circumstances, and that we rely on science for that information. However, the choice about what should happen is not a function of fact alone, but also of value. When it comes to value, a scientist has no more authority than anyone else.

The thesis that pure environmental science cannot define environmental health is one that practicing environmental scientists will find difficult to swallow, although its simple logic is inescapable. They will feel that they know the environment better than anyone, so they are best placed to advise us about its health. Advise, yes, but defining what is best, no. Certainly, we want to hear the advice of environmental scientists on this issue. We want to know about the unforeseen consequences of our actions, which we might later regret—as well as those we might later enjoy. These are matters of fact, after all, of the form “If you do X, then expect Y,” and about them we accept pure science’s authority. However, the question of whether we ought to avoid Y or aim for Y extends beyond that authority. We are willing to hear scientists’ opinion about what we should or should not do, in fact we welcome it, but in this they do not speak with the voice of scientific authority but as fellow human beings.
If environmental scientists find it hard to accept that their science cannot define environmental health, one reason might be that biologists are in the habit of studying the diseases of animals, which implies that disease and health are defined scientifically. This is all part of biologists’ practice of understanding life in terms of function. This is ironic, since the very concept of function involves final causation, and officially, biologists have banished final causality from their discipline. Indeed, all of modern science has done so. A final cause is one toward which things aim. For example, we are citing a final cause when we say that a cat hunts mice because it needs nourishment. Biology does not accept such explanations. Getting nourishment cannot be the cause of the hunting, since it occurs after it. The future cannot affect the past. Every biologist agrees to these well-rehearsed points.
Nevertheless, at the level of every day biological investigation and discovery, the first thing that a biologist does when he or she comes across something new and intriguing is to ask: What is its function? And the warm glow of understanding is achieved only when that function is discovered. Still, true scientific understanding is achieved only when the causal process underlying that function is revealed. The idea that the function, the intended purpose as it were, of DNA is to carry genetic information is not science. The science of DNA consists in the discovery of the causal processes whereby it replicates the proteins of parents in their offspring. Science is all about mechanism. It is not about purposes, goals, or intentions.
Function is purpose, purpose is goal, and goal is value, none of which belong to science. To identify a function of an organ is to identify a goal that the organ enables the organism to achieve: The eye enables the animal to see; the wing enables it to fly; the heart enables it to transport blood to its tissues.9 Goals are evaluative by their very nature: seeing, flying, or the circulation of the blood is good for the animal in question. To think of these functions as bits of the natural world alongside organisms, DNA, and so on, is unscientific. Nevertheless, one temptation for the environmental scientist will be to assume a function (for a specific ecosystem, say), then to fallaciously infer from this a proper function (for the ecosystem), and finally, to define health (of the ecosystem) in terms of the supposed proper function. For example, the function of the eye is to provide sight, and relative to that function the health or disease of the eye can be established. So an infection of the eye will make the eye unhealthy. It is tempting, then, for the biologist who has come this far to take the next step, which is to conclude that the eye infection is a bad thing, and so conclude a value claim solely on the basis of scientific facts.
That this is fallacious can be seen in the fact that the eye infection is a bad thing only relative to a presupposed function of the eye and the interests of the organism whose eye it is. Suppose, for instance, that the infected eye we are considering belonged to one of the 24 rabbits released by Thomas Austin in Australia in 1859, the very rabbits that went on to thrive and cause various effects on the local plants and animals that environmentalists universally reckon to have been devastating. Suppose that the microorganism that the rabbits had been infected with would have made them blind and unable to survive in the Australian countryside. Because the function of the rabbits’ eyes was impaired by the infection, it was bad for their eyes and bad for them. But from the point of view of the local plants and animals that would be saved from competition with the rabbits, the infection would have functioned as their salvation, and so would have been good—an opinion they would have shared with the microorganisms infecting the rabbits’ eyes themselves (my enemy’s enemy is my friend). Since values depend on point of view, the proper functioning of the rabbits’ eyes may be either good or bad. Functions do imply values, but only relative to a point of view.
Things only get worse when we try to infer the health of an ecosystem from its function or functions. From the point of view of the pronghorn antelope, the function of its kidneys is to cleanse its blood. But from the point of view of the plants in its terrain, the function of its kidneys is to fix nitrogen and disperse it in the soil in a form the plants can absorb. And from the point of view of the mountain lions that prey on the pronghorn, the function of their kidneys is as a nutritious snack. If we try to figure out functions eco-systemically, we are forced to make an arbitrary choice of a particular point of view within it. The ecosystem is an abstraction, and it has no point of view, even though everything that lives in it does. The ecosystem is just the present time slice of biological activity conceived (vaguely) as a system, a set of interlocking functions. Without function, there is no system. As for the land itself, it is merely the stage upon which life has acted out innumerable dramatic episodes, although it has spent most of the last few million years under hundreds of meters of ice.
6.6 THE SPECIAL CHALLENGE FACED BY PURE ENVIRONMENTAL SCIENCE
The epistemic mission of pure environmental science (PES) is to understand the biological world as a unified system. Traditionally, science has studied the world by analysis: breaking it into pieces, with designated specialists studying each piece. So far, biology has followed this plan. Biology is the study of life, but you will only find out what life is by studying all of its various aspects: cellular metabolism, reproduction, genetics, speciation, and so on. There is no generally recognized biological specialty devoted to the study of life as such. The botanist studies plants, the zoologist studies animals, the molecular biologist studies molecular processes, and so on. The goal of PES is to put all of the pieces back together again. Its identifying task is not the typical scientific task of analysis. PES is the biological specialty that aims at synthesis. If it succeeds, we will then have a specialty that does study life itself rather than simply its components. Because its job deviates from that of normal science, PES faces abnormal and extremely difficult problems. Even if environmental science succeeds in protecting its value neutrality, it still faces this special challenge not faced by the other sciences.
Science has traditionally relied on simplification and analysis in order to gain certainty, but PES aims at complexity and synthesis instead. The tradition of analysis and simplification can be illustrated by considering the case of freely falling bodies that Galileo first solved. Galileo’s genius was to recognize that the motion of actual falling bodies can be analyzed as the combination of two different mechanisms: the free fall of a body plus the resistance of the medium through which it falls. Actual falling bodies are a very mixed bag: The falling of a person to his knees is very different from the falling of a pendulum on its downward swing; the falling of a stone is very different from the falling of a feather. Galileo spotted the possibility of an underlying simplicity: The rate of fall of the person, the pendulum, the stone, and the feather would be the same if only they were not subject to different degrees and types of resistance. In a vacuum, Galileo opined, the feather would fall just as fast as the stone. Within a few decades, in 1659, the vacuum pump was built by Robert Hooke (1635–1703), and this soon led to one of the most important and persuasive experiments of the Age of Reason: direct comparison of the rate of fall of feathers and stones in a vacuum. In this classic experiment, air is pumped out of a tall glass jar, then a device simultaneously drops a feather and a lead weight, and both can be seen to fall at the same speed to the bottom of the jar.
What is often forgotten is that we still cannot precisely predict the rate of fall of the feather when it is back in the air—and as far as we can tell, never will. If a feather is dropped repeatedly from the same spot several feet above the ground, it will follow different paths to the ground, require different amounts of time to get there, and stop in distinctly different positions each time it is dropped—over and over, virtually forever. The unpredictability of the feather’s trajectory is a feature of nature itself. Even if extreme care is taken to make sure that the feather is in exactly the same position each time it is released, and to make sure that the air is calm, at the same temperature, humidity, and so on, the feather will follow a different line to the ground each time. In more scientific terms, even if we begin with the same initial conditions, the state of the system evolves differently each time. But put it as you like, how can different effects issue from the same cause?
The only answer is that there are (or must be) undetectably tiny differences in the initial conditions that quickly balloon into enormous differences in the path followed by the falling feather. Some of these differences do occur at the molecular level. We know that just controlling the temperature, pressure, and stillness of the air will not eliminate the differences at the molecular level. What we call temperature is just the average energy of the molecules of air surrounding the feather. Temperature is a mathematical construct, a pure abstraction, a gross measure that we use because we know how to measure it. If we are to have any hope of precisely calculating the trajectory of the feather when it is released, we need to know, for starters, the actual energy of each of the air molecules that will collide with the feather before and during its fall. But getting precise information about these trillions of molecular collisions is a technical impossibility and will remain so for the foreseeable future. Calculating their effects poses an even more difficult problem that we are unable to solve even in principle, given that computational power is limited in the end by the sheer size of any possible computer.
The only thing to do is swallow hard and admit that as far as we can tell, we will just have to be happy with predicting the average trajectory of the feather. We have good scientific reasons for believing that this is about as good as it will ever get. The scientific phenomenon that limits the precision and accuracy of science is well studied and well understood. It is often called “infinite sensitivity to initial conditions,” or, more popularly, chaos.10 Chaos is a misnomer, since chaos implies freedom from the rule of natural law, whereas the systems in question are thought to be fully determined by law, but nevertheless, unpredictable. Unfortunately, the biological systems that PES studies are like the feather released in the air, not like the feather falling in a vacuum. They are complex systems, whereas the highly accurate models on which science has built its reputation always deal with simple systems. The essence of modeling is simplification. A model is necessarily less complex than the reality it represents. A map cannot contain the complexity of the real terrain, and a model of the atmosphere running in a computer the size of a box cannot contain the endless details of the massively larger and more complex atmosphere itself. Since the behavior of the atmosphere depends very sensitively on just those details, no model can predict its behavior.
Science has gained its reputation for precise prediction through its success with purposely simplified systems. The natural systems that science has been able to predict with precision and accuracy have been in the heavens, not on Earth. The solar system is a naturally occurring simplified system. Sunrise, sunset, and eclipses of the Sun or Moon can be predicted to the second months or years in advance. But when it comes to earthly phenomena, precision and accuracy have been restricted to cases where we have created simplicity in the lab or in the computer. The behavior of ordinary, complex systems that are found in the real world outside the laboratory has largely remained outside the scientific domain. The discovery of chaos and the development of chaos theory shows that this struggle will, as far as we now can tell, never be won. Approximation and compromise are the best we can hope for.
As Nancy Cartwright (1999) puts it, we live in a dappled world: a world that, despite science, is still full of possibilities, surprising events, and wonders that we have not yet appreciated. Science rules in worlds of its own making, the world of the fundamental simple forces and processes where physics and chemistry prevail. On the laboratory bench and in the technological innovations it has made possible, science has achieved levels of precision that are absolutely stunning. This precision itself is an excellent reason to accept that nature is lawlike throughout, not just on the lab bench. Presumably the laws of physics and chemistry and all the physical sciences rule everywhere, but even so, that does not permit the rest of the world to be predicted by science. In the perfect vacuum of the bell jar, the perfect mechanics of Newton prevails, but outside the bell jar, feathers and leaves and raindrops fall to Earth, tracing paths no human being can predict. In the perfect vacuum of the particle accelerator, quantum mechanics and relativity prevail, but outside it the weather takes its own unpredictable course here on Earth as on the Sun and a thousand other planets and suns. Thus, the world will continue to surprise us. To bring this discussion of chaos back down to Earth, life itself is not predictable. We will run into friends that we never thought we would meet again11 and make new friends whose identities must remain a mystery to us until then.

On September 11, 2007, the sixth anniversary of the attacks on the World Trade Center and the Pentagon, Osama bin Laden spoke out against global warming. This marks a triumph for environmentalism, for it shows that it has become truly global. Although Osama has very few beliefs in common with my neighbors and friends, he does share with them a concern for the health of the planet. Osama bin Laden, Al Gore, Pope Benedict, Bill Gates, Noam Chomsky, Madonna, the Dalai Lama, George Bush, Vladimir Putin, and the National Chief of the Canadian Assembly of First Nations, Phil Fontaine, are a diverse group of human leaders. Yet they all have one thing in common: They believe (or believe in) global warming. The global warming theory (GWT) is arguably the first truly global news story, one that reaches not only everyone’s ears but also their hearts and pocketbooks. The entire human race has been told that the centuries-long party of economic growth is over, and now the CO₂ bill has to be paid. Sure, there were stories of global interest before, especially those predicting nuclear apocalypse a generation ago, but those were only warnings of things to come. Global warming, we are told, is happening right now, and must be stopped by reducing CO₂ emissions right now.
Whatever we human beings do in response to the threat of global warming, it will be momentous for the environment, and momentous for you and me. Even if we do not live to see the days when the threat is supposed to be realized, we are charged with making up the collective mind of the human race today. We cannot address environmentalism today without addressing global warming.12
The Threat Forecast by Global Warming Theory. The International Panel on Climate Change (IPCC) officially states in its latest, and fourth, assessment report that nearly every one of the last several years is among the several hottest in 1000 years or more. It also states that the warming is caused by us, and that it cannot be stopped, only mitigated. Even if CO₂ emissions are totally eliminated by 2100, the warming will last for thousands of years (AR4, pp. 77–80).13 According to the press releases of the IPCC, the result will be an ecological catastrophe—the realization of the environmental apocalypse that has been forewarned, and feared, since the 1960s.14 Therefore, we must begin scaling back the use of fossil fuels as quickly as possible in order to limit the damage: reduce CO₂ emissions to 5% below 1990 levels by 2010, to 50% below 1990 levels by 2050, with 100% reduction (total elimination) of CO₂ emissions by 2100.15
The Threat of Global Depression. Why have we not met these reduction targets? Surely if it were easy to do, we would have done it. The problem is that the human economy runs on energy, and the majority of this energy comes from fire and hence produces CO₂. Meeting the first of the Kyoto targets would have caused a massive global depression. Since emissions have grown steadily since 1990, meeting the first target would now require a global cut of over 20% of current emissions, which cannot be done without massive disruption of every sector of the economy, including food production. In short, human beings do not know how to obtain the necessities of life without the burning of fossil fuels. So the first target cannot and will not be met. The IPCC nevertheless insists loudly and resolutely that we must start making cuts to CO₂ emissions. This cannot be done without putting the brakes on the global economy. We all know that it hurts when the economy slows down: We work less, we spend less, we travel less, we buy fewer clothes, fewer books, cheaper foods, give less to charity—we live less. The IPCC itself says “it is clear that the future impacts of climate change are dependent not only on the rate of climate change, but also on the future social, economic and technological state of the world” (op. cit., p. 824). This is, of course, perfectly true. It is something that we all have learned from our own personal experience.
A simple, inconvenient truth is forgotten by those who call for cuts to CO₂ emissions: The economy is nothing other than the sum total of the ways in which we human beings make a living. It includes everyone: laborers, hockey players, professors, farmers, industrialists, native herders, astronauts, environmental pundits, and priests. The word, economy, conjures up the image of money, but money is merely the counter in the social system that we have developed to help us make our living. Food, clothing, and shelter are the main business of the economy, and when business is bad, they are just that much harder to get. Our economy is integrated with our bodily metabolism in the same way that the business of bees, gathering honey, is integrated with their bodily metabolism. Bees have an economy, too: the economy of the hive. In the bee economy, worker bees build hives and honeycombs, gather honey and store it in the honeycombs, and then distribute it among themselves and their offspring. In the human economy we humans build houses and storage elevators, plant fields and gather food, and then distribute it among ourselves and our offspring. But unlike the bees, our methods of doing all of this have evolved so that they now depend on the use of fire. At the moment, we cannot survive without fire. It is conceivable that we can gradually transform our economy, but we do not know how to do that right now, today. If we cut CO₂ emissions, we will reduce overall economic activity—in other words, cause an economic depression.16
It may seem odd that the ones who are first to suffer from a downturn in the economy are those who seem farthest from it, those who have the least to do with money, the rural poor who eke out a living tending a garden and a few chickens. It is true, nevertheless. If we remember that “the economy” is just another term for humankind making its living, it will not seem so odd: When it gets harder in general to make a living, those who just barely make a living will be hurt most. The poor need to buy the things they cannot or do not make for themselves, such things as matches, soap, toilet paper, needles, thread, fabric, eyeglasses, toothbrushes, pots, pans, shovels, plows, books, shoes, medicines—the countless “little” things that make life possible and tolerable. When the economy goes bad, these things become more expensive, the money to pay for them becomes scarcer, and the poor must suffer doing without, the worst form of economic hardship.
Because global warming pits the good of the environment against the good of the economy, it threatens to hit us all where it hurts, and where it hurts the poor most. Of course, the impression created by those who profess and promote the Kyoto Accords is that the only ones to be hurt will be the rich, greedy people at the heart of the problem in the first place. This is, as anyone with any experience of things on this Earth knows, false. The rich, as always, will do best no matter what circumstances prevail. The poor themselves will testify that they suffer most during hard times.
The Question. The IPCC presents humankind with the following argument:
- Premise: GWT is true.
- Conclusion: Therefore, we must reduce CO₂ emissions.
Thus, humankind faces two questions. First, the factual question: Is GWT true? Second the value question: Should we reduce CO₂ emissions if GWT is true? Here we address only the first question, the factual question, with the understanding that what is at stake is the rest of the IPCC argument. Thus, our question may be restated as follows: Are we sufficiently confident in the truth of GWT to slow the human economy because of it?
Yes 1: The Greenhouse Argument Proves Global Warming Theory. The green-house gases (GHGs) we produce are like the glass walls of a greenhouse: They let in the heat from the Sun while preventing its escape, as shown in Figure 6.1. There is a
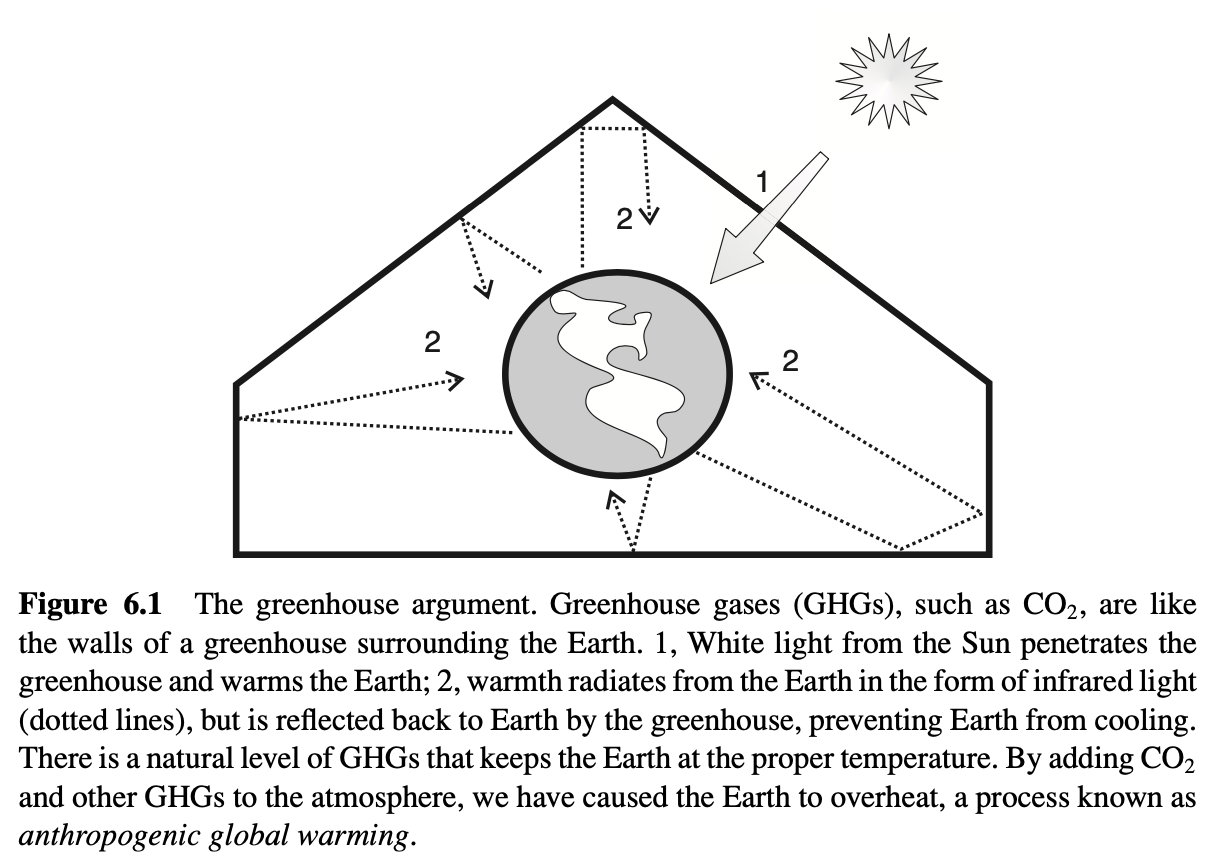
natural level of CO₂ that keeps the temperature where it should be. We have disturbed this natural level by using fossil fuels and thus have disturbed the temperature by making the glass in the greenhouse thicker. This “runaway greenhouse heating” means that Earth is headed for ever higher temperatures and environmental disaster.
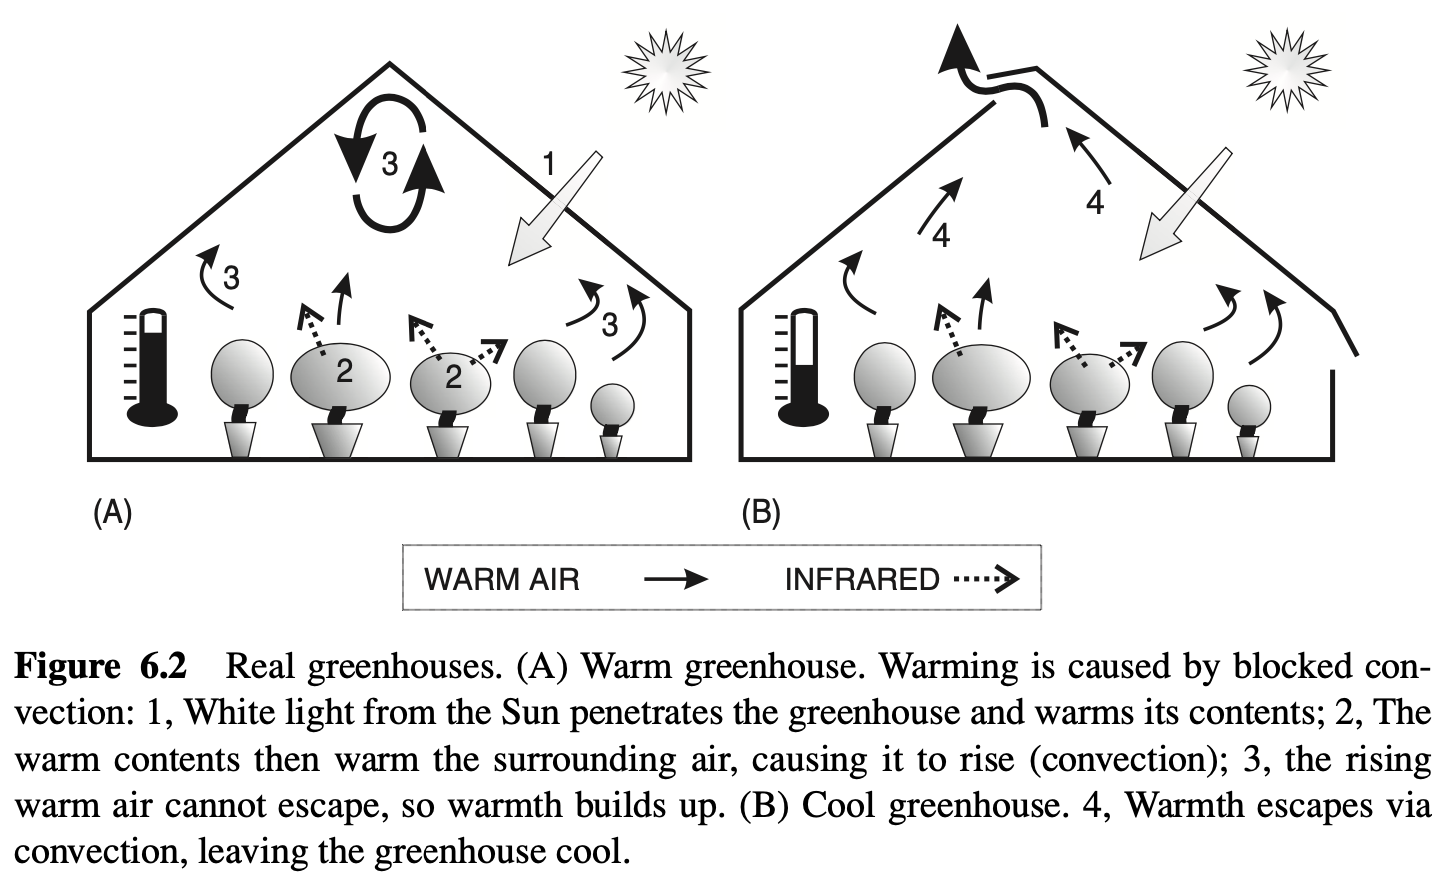
No 1: TheGreenhouse“Argument ”Is Merely a Misleading Metaphor. No doubt the political persuasiveness of popular GWT turns on the fact that everyone knows that greenhouses, like automobiles, get very warm in the Sun—even though in the greenhouse metaphor the actual mechanism of this warming is misrepresented. Although it is true that glass is more transparent to visible light than to infrared, this radiation effect is inconsequential in an actual greenhouse. Actual greenhouses work by interrupting air circulation, as shown in Figure 6.2A. If the greenhouse does not trap warm air inside, it is no warmer inside than out, as shown in Figure 6.2B. Greenhouse operators know this, since they cool their greenhouses by opening vents that permit warmed air to escape, although this has very little effect on the radiation balance within the greenhouse.17 So, despite the fact that radiation is still trapped as much as it ever was, the greenhouse cools. In an actual greenhouse, the warming of air by infrared radiation causes air motion, just as it does in the atmosphere outside. Convection is a natural engine that is powered by infrared light, converting heat into motion. This engine normally transports heat upward and away. A greenhouse gets warmer because it prevents this natural engine from working. Since it is false that GHGs prevent convection, the greenhouse argument simply fails to apply to the actual atmosphere.
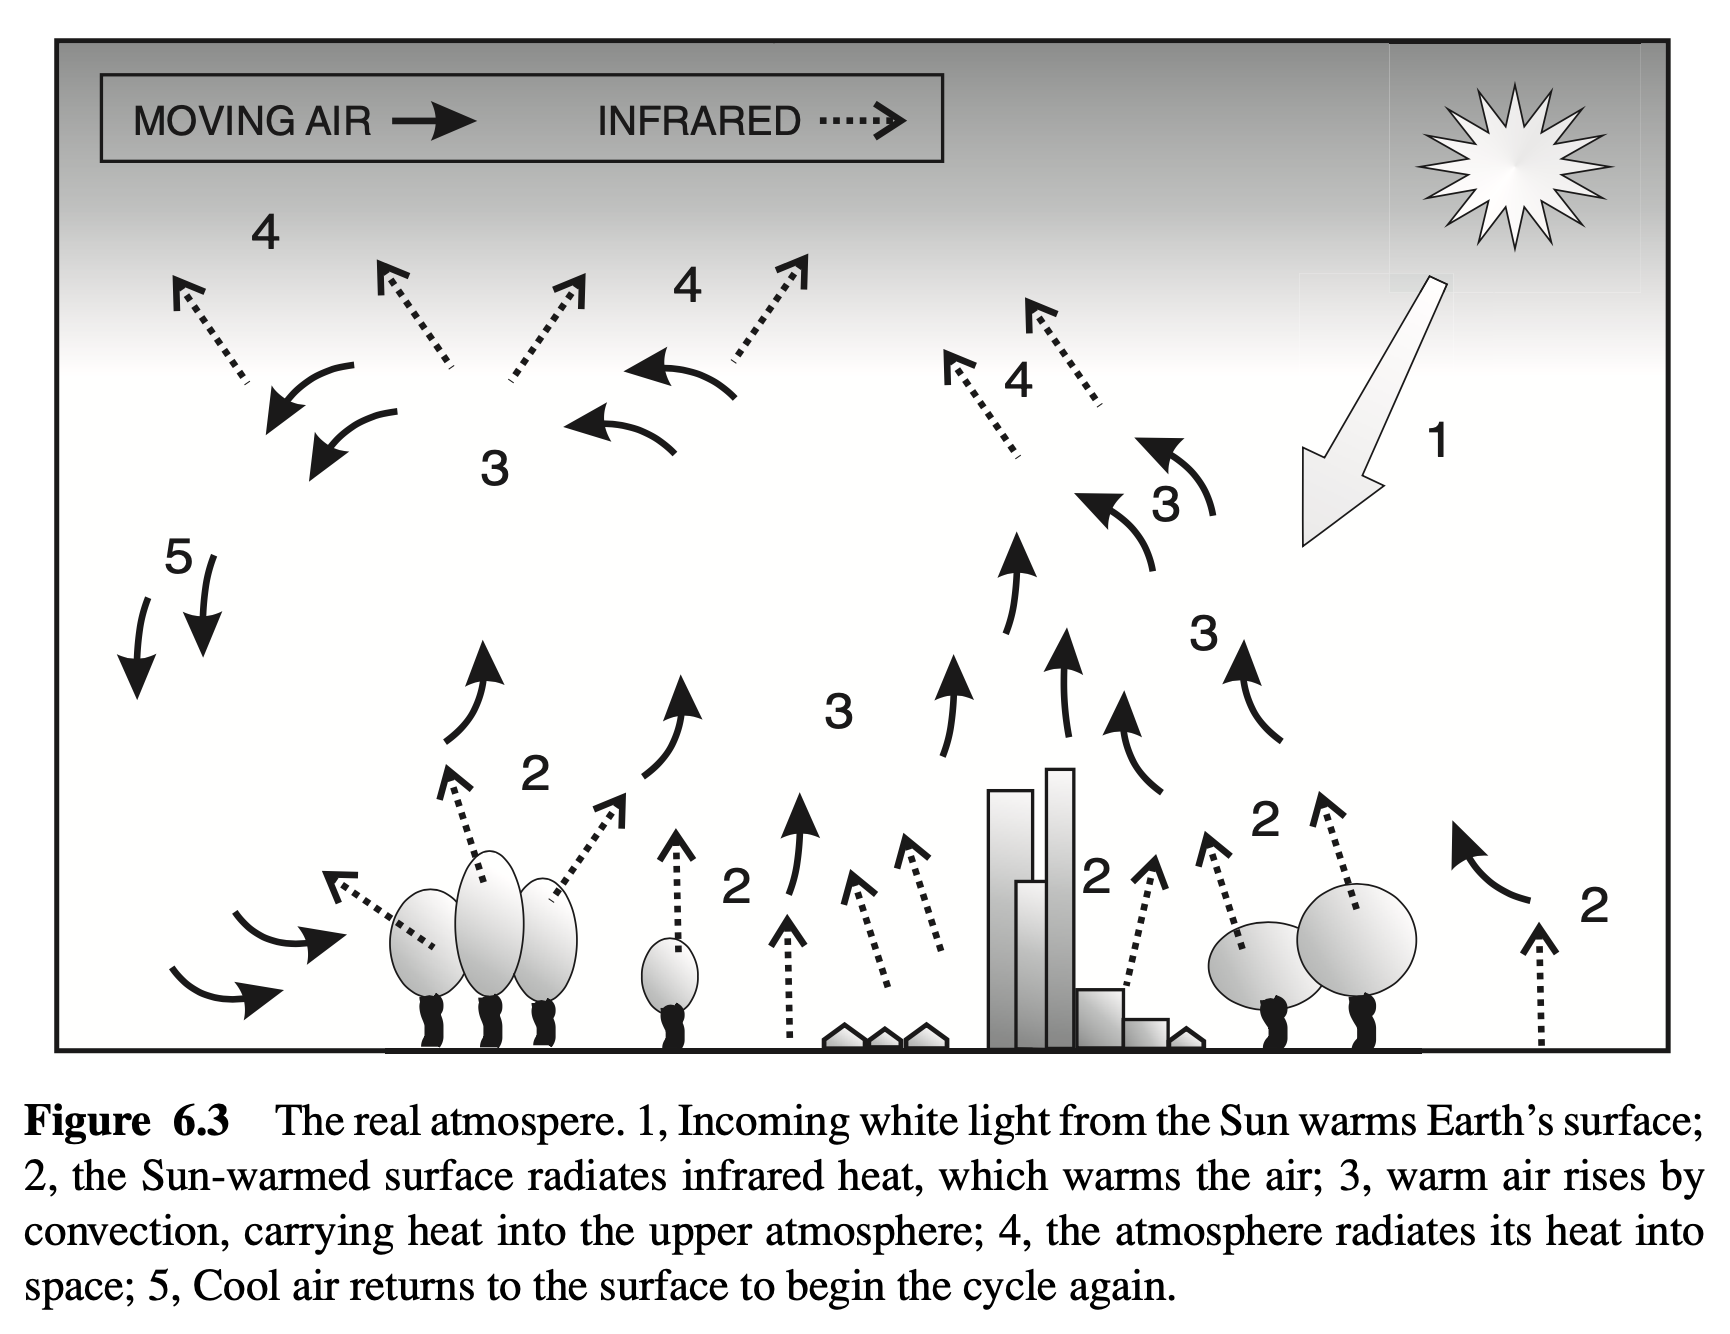
In the actual atmosphere, incoming white light from the Sun does not directly heat our atmosphere, which is nearly transparent to white light.18 Instead, our planetary warmth begins at the surface when the visible light of the Sun is absorbed by oceans, ground, buildings, trees, and so on, and warms them, as shown in Figure 6.3.Warm things radiate heat: They glow. We can see a red-hot nail glow, but warm rocks, trees, buildings, even our own bodies, glow too, only in a milder way, that we cannot see with the naked eye, in the infrared. In this way, Earth’s surface warmth is radiated as infrared light into the overlying atmosphere. Most of this infrared radiation is absorbed, since the lower atmosphere is nearly opaque to infrared light.19
The surface layer of atmosphere would become too hot were it not for convection, the main engine of global cooling and precisely what is left out of the greenhouse argument. Warm air expands, gets lighter (weighs less per unit of volume), and so rises (or is buoyed upward by the heavier air around it). When warm air rises because of convection, the air around it moves in to replace it, causing wind. The moving atmosphere interacts with the land, the waters, the vegetation, the mountains, the glaciers, and so on, both picking up and losing such things as dust, gases, heat, and water vapor. The rising air stirs this moisture and heat, creating rain, storms, waves, hurricanes, thunder, and lightning—all of the ongoing drama that we call weather. In the process, the heat that began at the surface makes its way to the upper atmosphere, where it can escape as infrared radiation into outer space. So the real atmosphere is a bit like the cool greenhouse from Figure 6.2B, but nothing at all like a closed greenhouse. Thus, the greenhouse argument simply does not apply.
Yes 2: The Anthropogenic Forcing Argument. The greenhouse argument is, admittedly, a simplification, but it does get to the heart of the matter. Of course, the climate is complex, just as the last objection states—in fact, its sketch of the real climate barely scratches the surface. That is why we rely on sophisticated climate models to tell us what the climate will do. There simply is no way that the human mind can completely comprehend a system as chaotic as the climate. It is just too complex. In addition to the factors you mention, it also involves more complex things, such as latent heat exchanges when water is vaporized or condenses, not to mention aerosols such as sulfates, smoke, and just plain old dust, to mention just their main varieties. These models include convection, the main concern of the previous objection. Nothing that makes any difference at all to climate is left out of these models. In fact, GWT employs a hierarchy of models, some devoted to a single phenomenon such as convection or air–ocean heat transfers, and some that put all of the pieces together again so that we can see the big picture.20 In these models the currency of the realm is radiation. All of Earth’s climate energy comes to the planet as radiation and leaves as radiation. Convection, aerosols, GHGs, and so on, are relevant to climate only insofar as they affect the radiation balance of the planet. So all of these things are reduced to a set of parameters quantifying their radiation effects; this method is called parameterization.21
One of the things that climate models tell us is that the overall effect of GHGs is to reflect, or reemit, infrared radiation back down toward Earth’s surface. That is the kernel of truth that is captured in the greenhouse argument, despite its simplifications. Indeed, that is its whole point: to make the role of GHGs plain. When scientists speak about the greenhouse effect (or greenhouse warming), they are talking about this overall warming effect of GHGs, as shown in Figure 6.4. Other things being equal, adding GHGs to the atmosphere slows heat’s escape. To state it in a homely way, additional GHGs cause heat in its infrared form to bounce around more inside the atmosphere before it escapes into space, increasing the heat it contains and thus raising
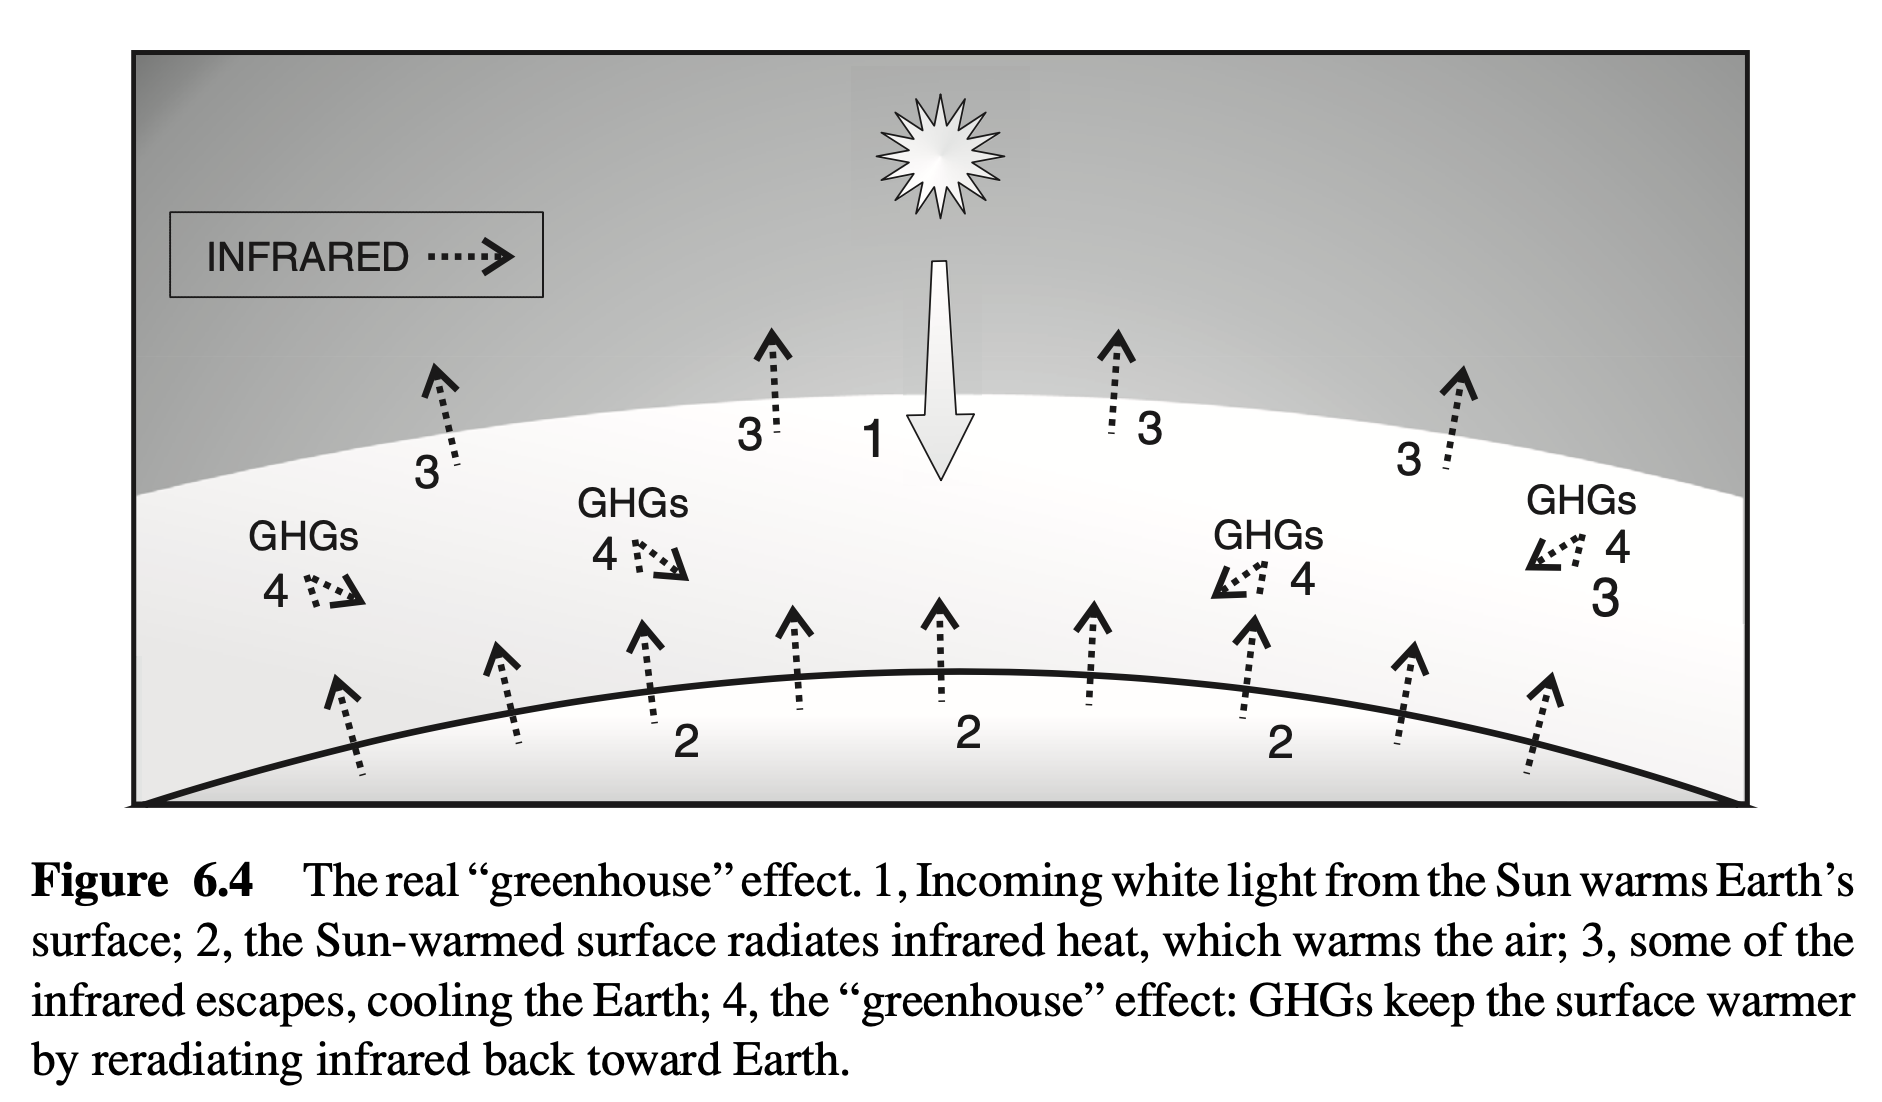
its temperature. This effect, known popularly as the greenhouse effect, is called anthropogenic forcing when human activities are the source of the added GHGs, and has been calculated precisely.22
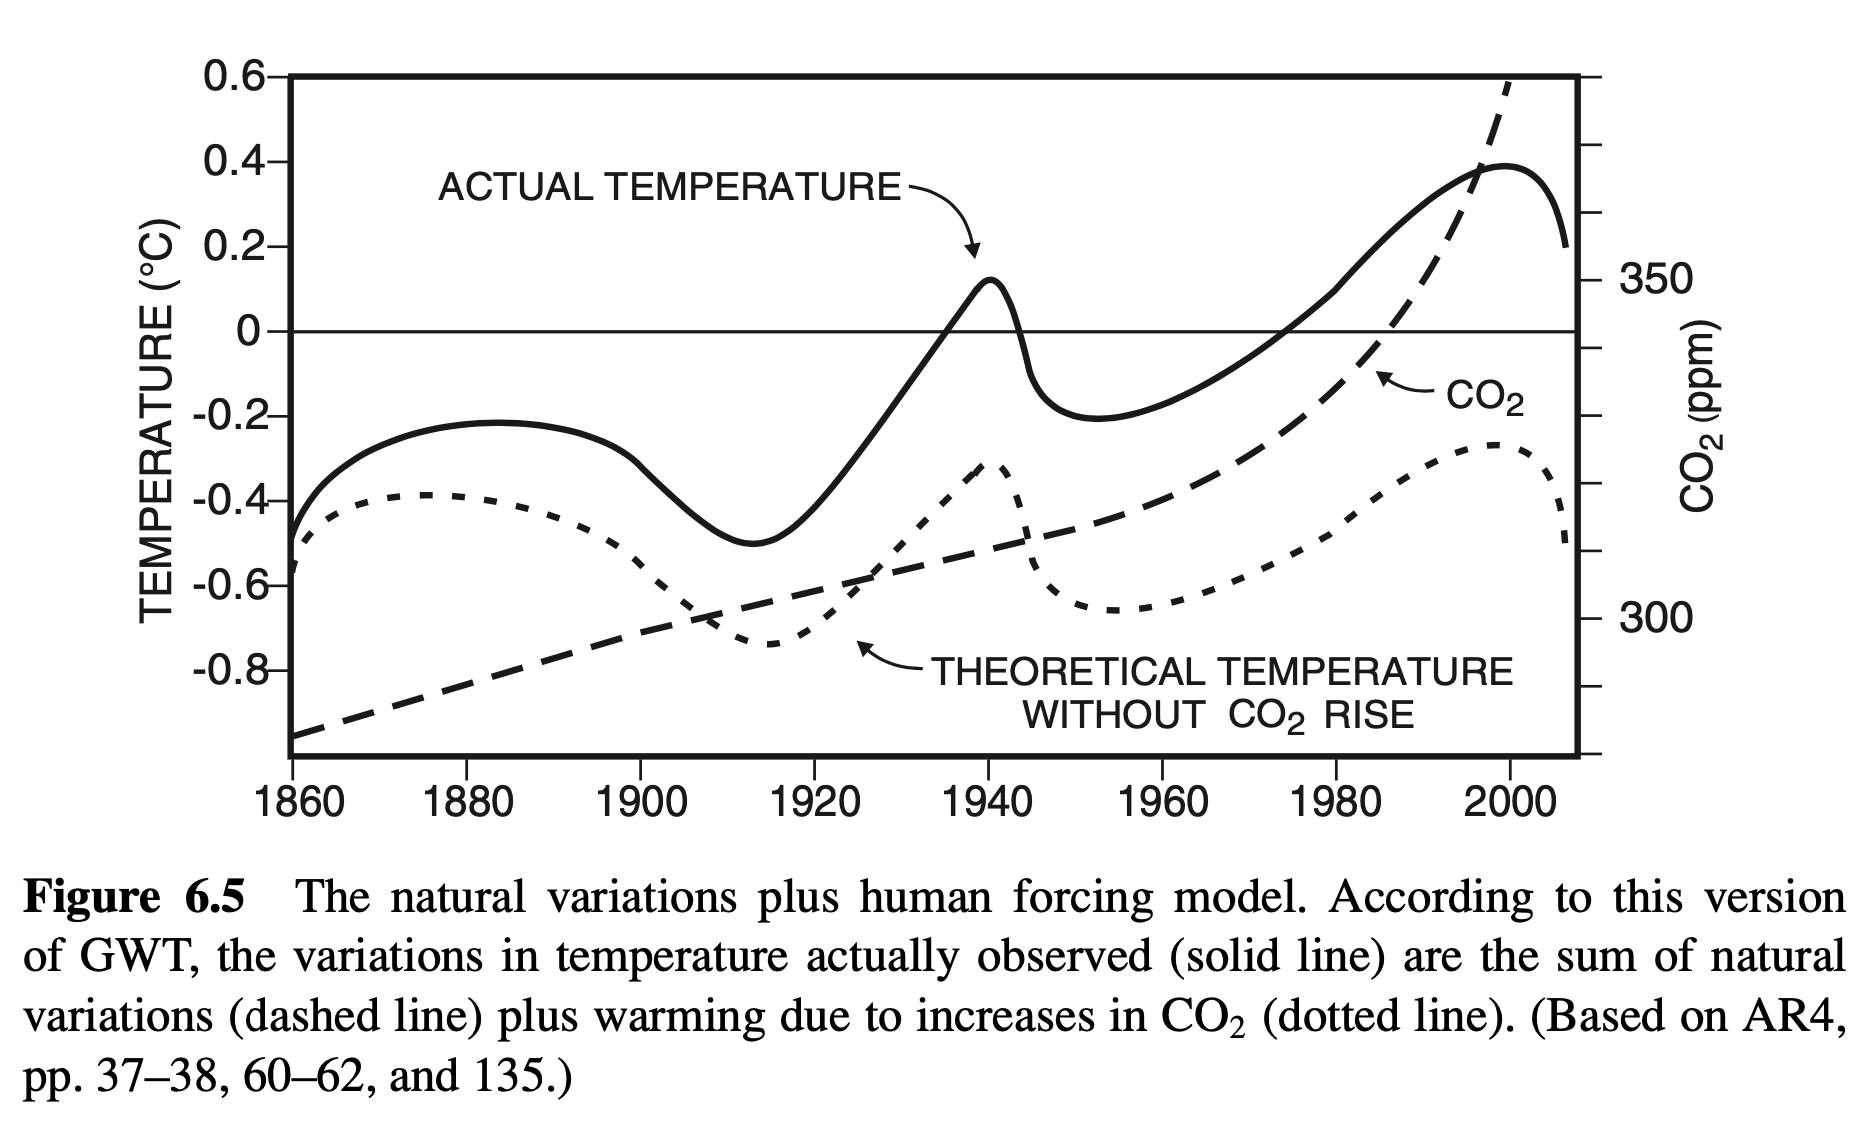
Thus, GWT is the claim that part of the temperature rise we have observed since 1750 is due to global warming. Since global temperature is varying continually anyway due to natural variations, we can think of it as the sum of natural variation plus human forcing, which gives us the NV + HF model of GWT, shown in Figure 6.5.
No 2: GWT Requires a Predictive Model of Climate as a Whole. Now that the complexity of the problem is out in the open, we have to realize that unless we know what the climate would have been like given natural variations, we can only assume that a specific portion of the current temperature is due to human forcing by GHGs. No matter what the temperature is, or whether it is going up or down, it can always be claimed that some portion of it is due to human forcing. The only way that actual temperature data can be used in support of the NV + HF model of GWT is to have independent calculations of both natural variations (NVs) and human forcing (HF). Without independent calculations for both, GWT fails to say anything specific or precise about what the temperature will be, so the question of whether it is true simply cannot be answered. To put it another way, until we know what the natural variations will be, we do not know what the NV + HF model is saying. The NV + HF model is oversimplified. It is an efficient way to explain GWT to the climatologically unschooled—and to persuade them to believe it—but it is too vague to be tested or to serve as a real scientific hypothesis. Unless we know what the climate would have done without human forcing, we cannot measure the effects of human forcing. That this is so is reflected in the fact that officially, at least, IPCC climate scientists do not use the NV + HF model as part of the scientific basis for GWT.23 Instead, they try to explain past climates, including even paleoclimates, to show that their climate models are up to the task of predicting warming over the coming centuries. However, it is not at all clear that their models are capable of predicting—or retro-dicting, or even accommodating—past climates. The anthropogenic forcing model simply ignores the necessity for accurate prediction of past and current climate—and the huge, unsolved problems that this entails for GWT.
Yes 3: Multiple Feedback Models Prove GWT. Admittedly, the NV + HF model is simplified, although at its core there is a kernel of truth: that human GHG forcing will inevitably warm the climate. However, the criticism that we must be able to model what the climate would have been without human forcing is recognized by the IPCC. To do this, the IPCC uses the most sophisticated climate models in existence, multiple feedback models (MFMs). MFMs incorporate all the significant factors that influence climate, recognizing that these factors interact with each other in complex ways, sometimes reinforcing each other (positive feedback), sometimes weakening each other (negative feedback). A rough idea of MFMs is given in Figure 6.6. MFMs enable us to provide what you call for: independent calculations of both natural variations (NVs) and human forcing (HF). Indeed, the IPCC’s official argument in favor of GWT turns on comparing models of natural variations in temperature with models that also
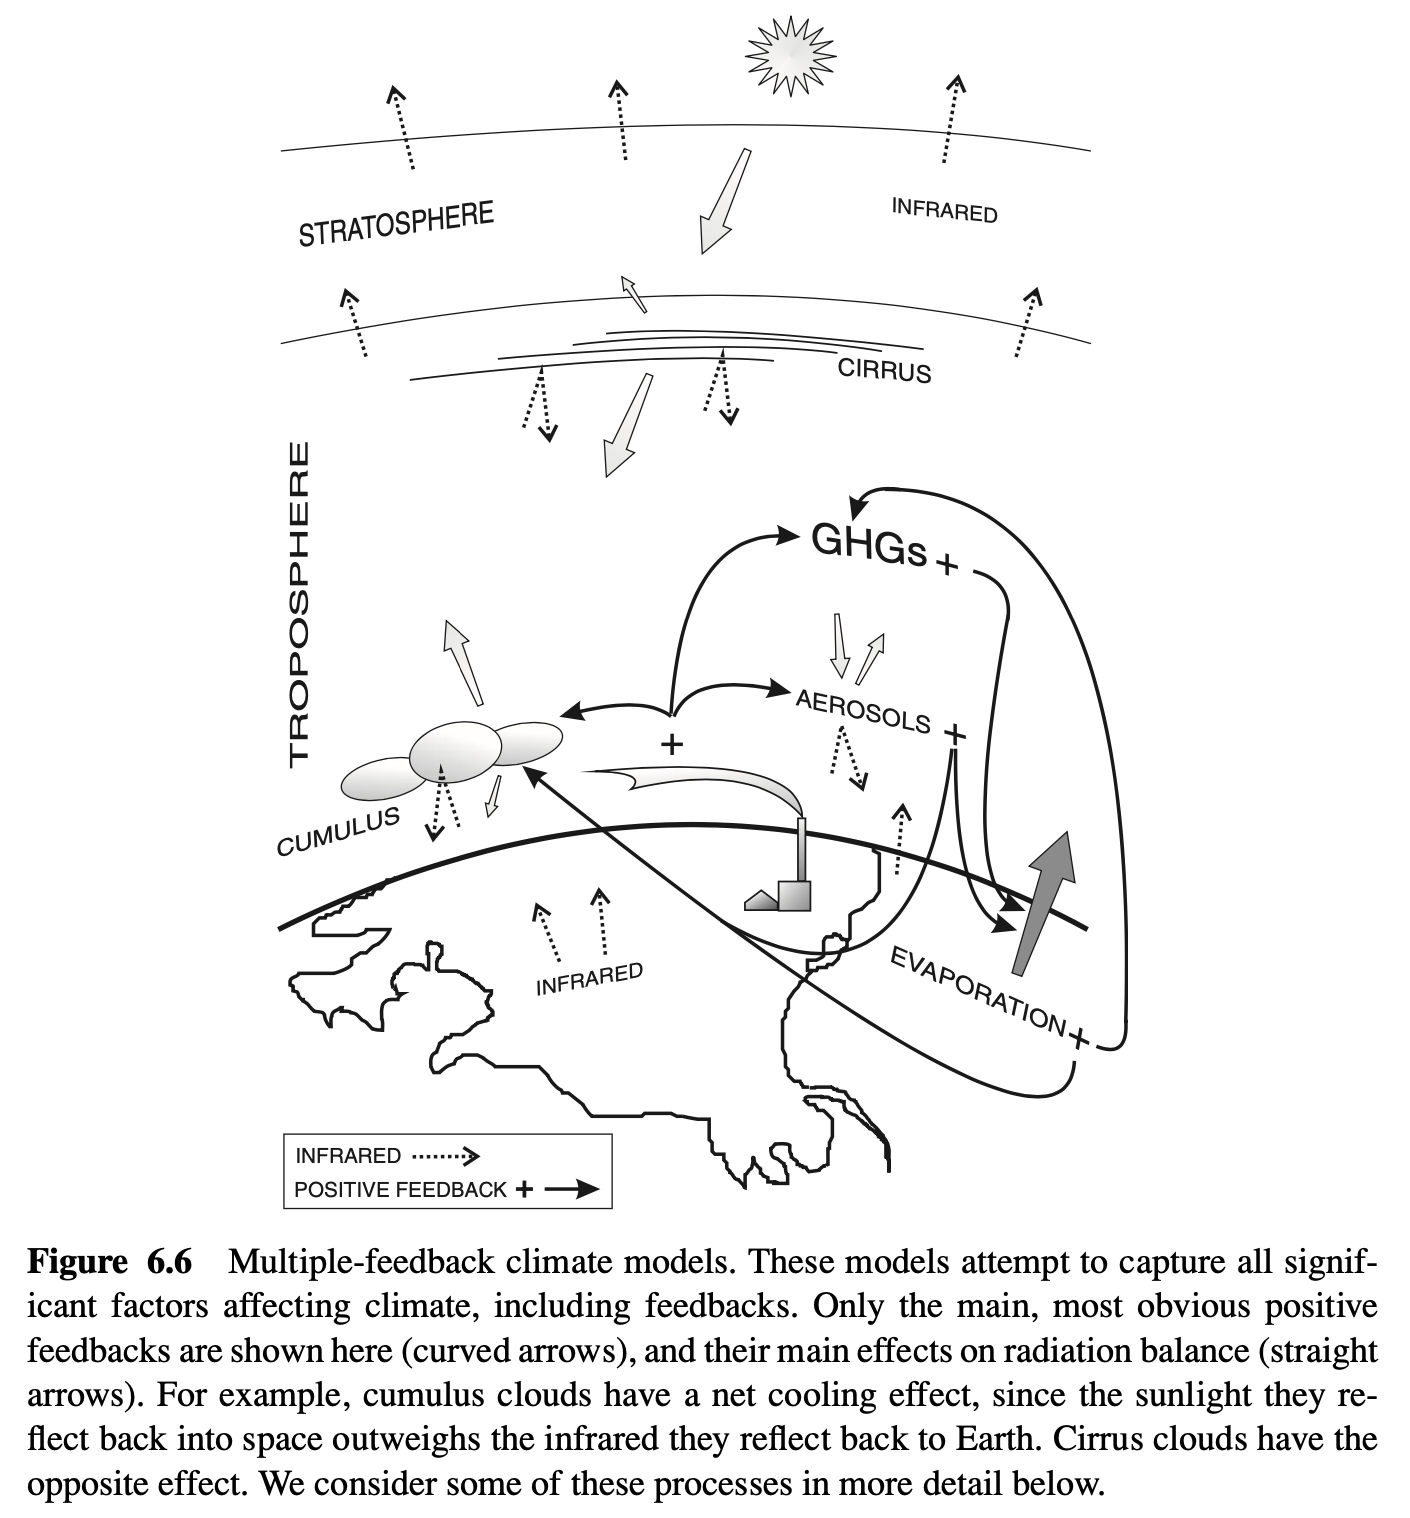
include anthropogenic forcing.24 When the two sorts of models are compared, it is obvious that the actual rise of global temperature since 1970 or so cannot be explained except by GWT.
No 3: Earth’s Radiation Balance Contradicts GWT. Once it is granted that we must use MFMs, it is granted that nothing less than an adequate model of the entire climate system is required by GWT, and we simply do not have that level of understanding at this point in history. Every climate scientist, including the authors of the IPCC assessment reports, admit to significant gaps in data, theory, and modeling capacity that systematically undermine our confidence in GWT. For example, just recently, data emerged that contradicted the basic premise of GWT. All three models of GWT, the greenhouse model, the anthropogenic forcing model, and the multiple
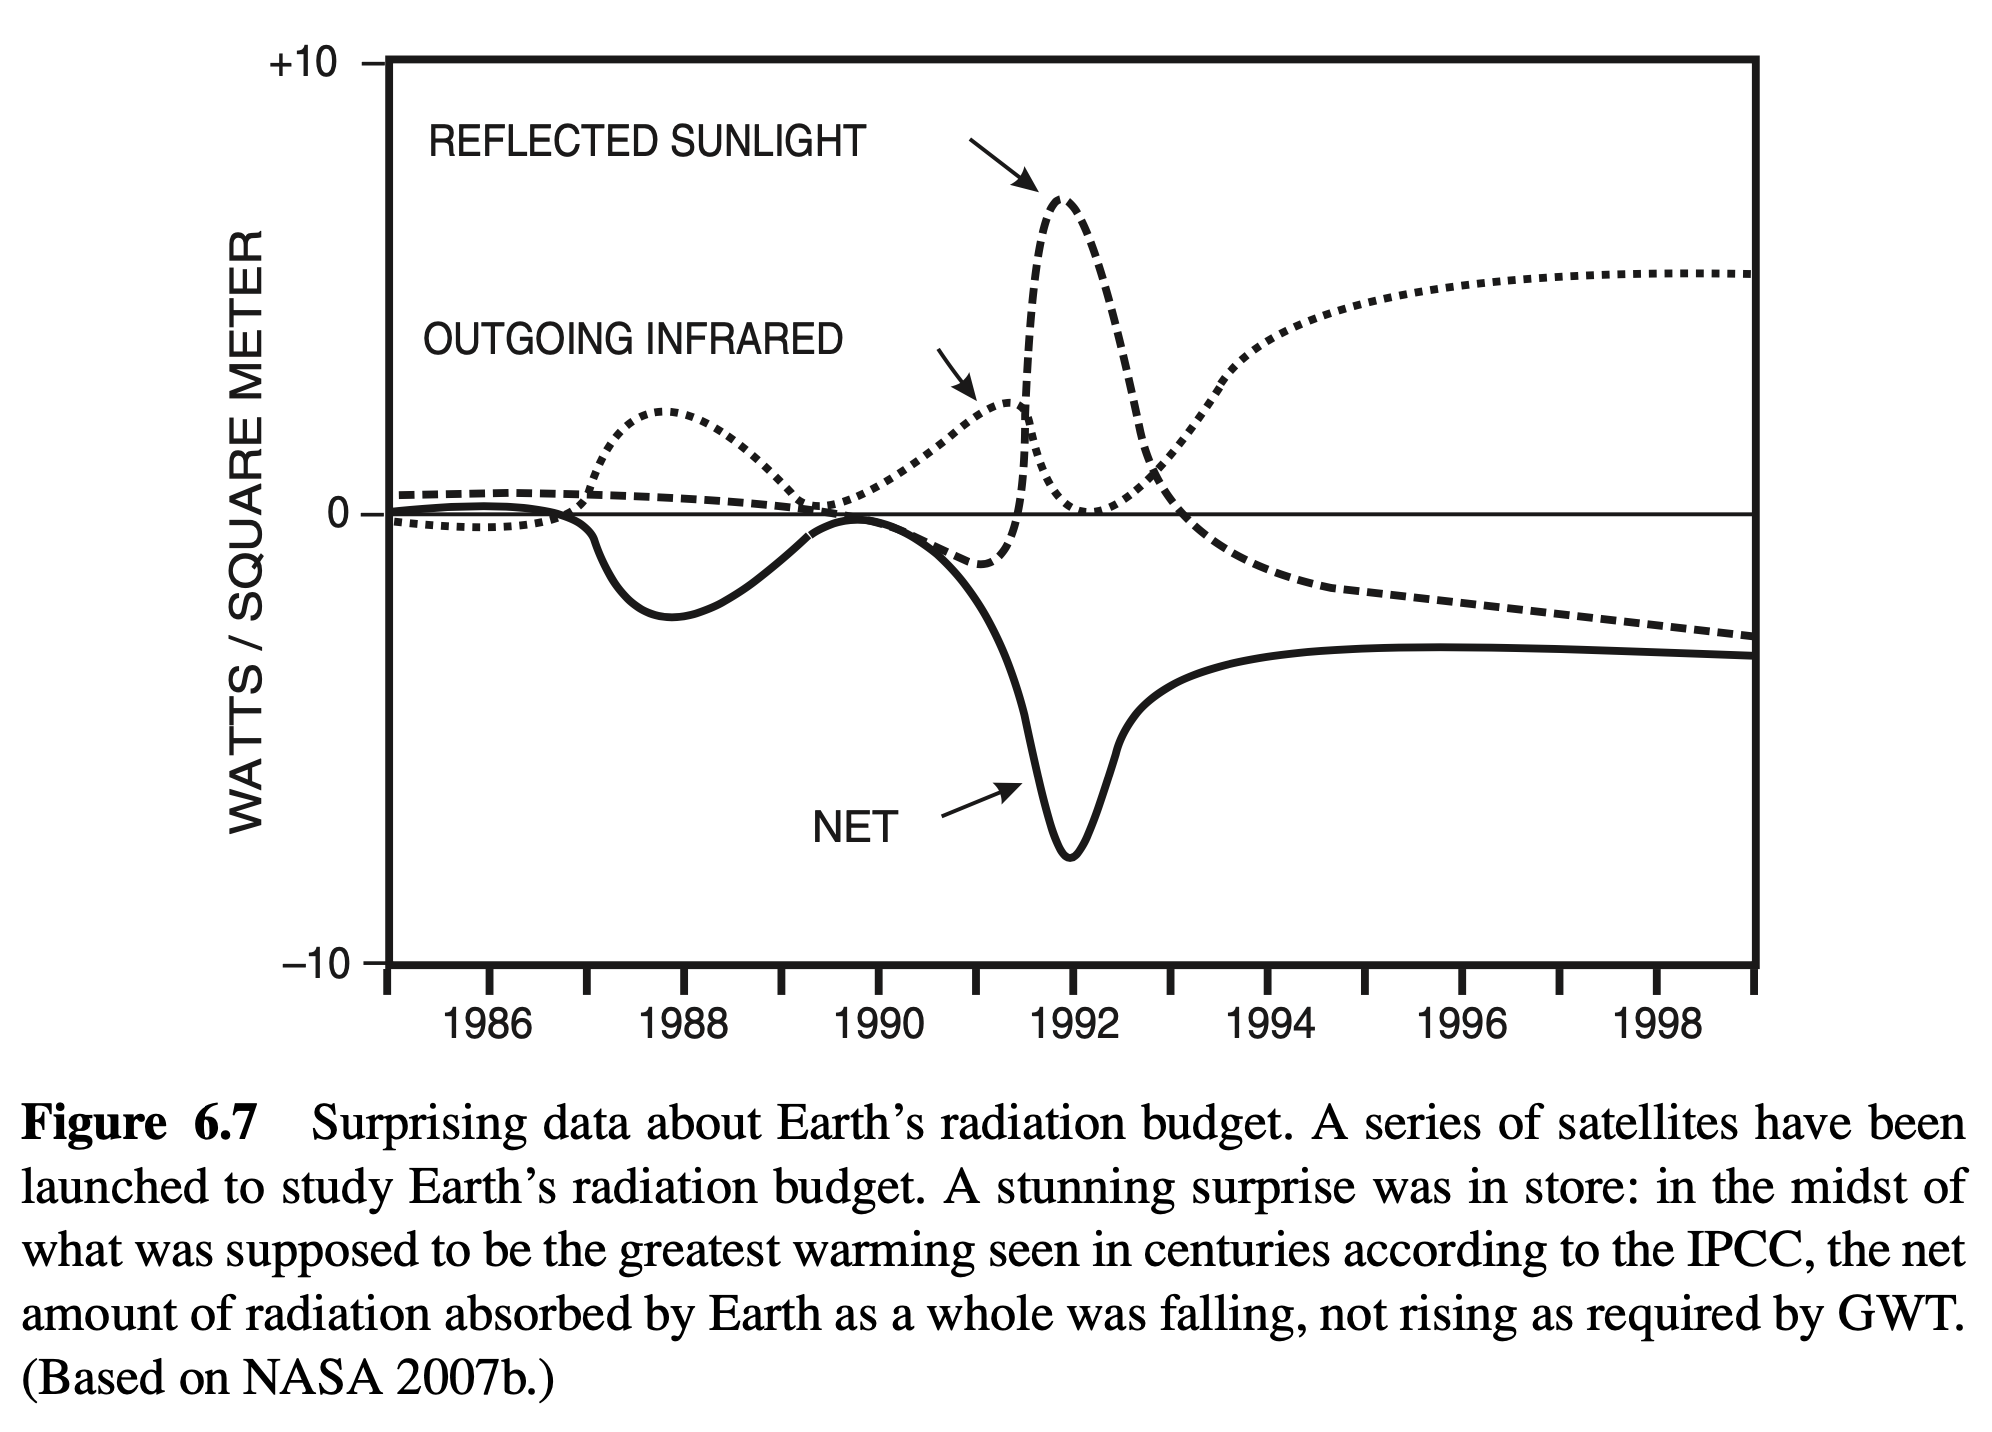
feedback model, have the same core thesis: that Earth’s outgoing infrared heat has been decreasing, and this has caused temperatures to rise. It should come as quite a shock to GWT supporters, then, that Earth’s radiation balance falsifies this thesis. Recent data show an increase in the amount of heat radiated from Earth into outer space (e.g., Chen et al. 2002, Hartmann 2002, Wielecki et al. 2002): “Satellite observations suggest that the thermal radiation emitted by Earth to space increased by more than 5 watts per square meter, while reflected sunlight decreased by less than 2 watts per square meter, in the tropics over the period 1985–2000, with most of the increase occurring after 1990” (Chen et al. 2002, p. 838). In other words, over the all-important tropics, at least, there is an increase in the solar radiation reaching Earth which is overwhelmed by an increase in the heat escaping Earth, for a net increase in outgoing radiation,25 as diagrammed in Figure 6.7.26
This result took the entire climatological community by surprise, which is a nice indicator of the current state of climatological science. With all due respect to the brilliant work being done by numerous climate scientists, climatology is still a young science that has a long way to go. A fast rise in temperature occurred precisely during the increase in outgoing radiation, precisely the opposite of what climatologists would expect and precisely the opposite of what GWT requires. When it comes to pure science, such unexpected results are actually very inspiring, since they shake up presuppositions and lead to new insights, new ideas, and new approaches. From the point of view of the IPCC, however, this result can only be problematic, because it shows just how little we understand about Earth’s complex, indeed chaotic, climate. Pure climatological scientists have been inspired to reassess Earth’s various modes of heat storage. One explanation of the rise in surface temperatures at the very same time that outgoing radiation increases would be a release of heat from the oceans. This, in turn, might help explain why temperatures have been falling over the last decade (since 1996), in contradiction to what GWT predicts.27
In any case, GWT is based on the premise that because of human GHGs, the net radiation balance for the planet is positive. Unfortunately, this has been shown to be false during the very period when the most global warming is supposed to have occurred. GWT provides neither explanation nor prediction of global warming when this premise is false. This means that the period of warming in question is not evidence in favor of GWT. Whatever the causal mechanism of the warming may have been, it was not the one outlined in GWT. A period of warming that is always cited as strongly indicative of GWT, from 1985 to 2000, occurred during a climate phase in which the Earth was losing heat, not gaining heat, as GWT requires.
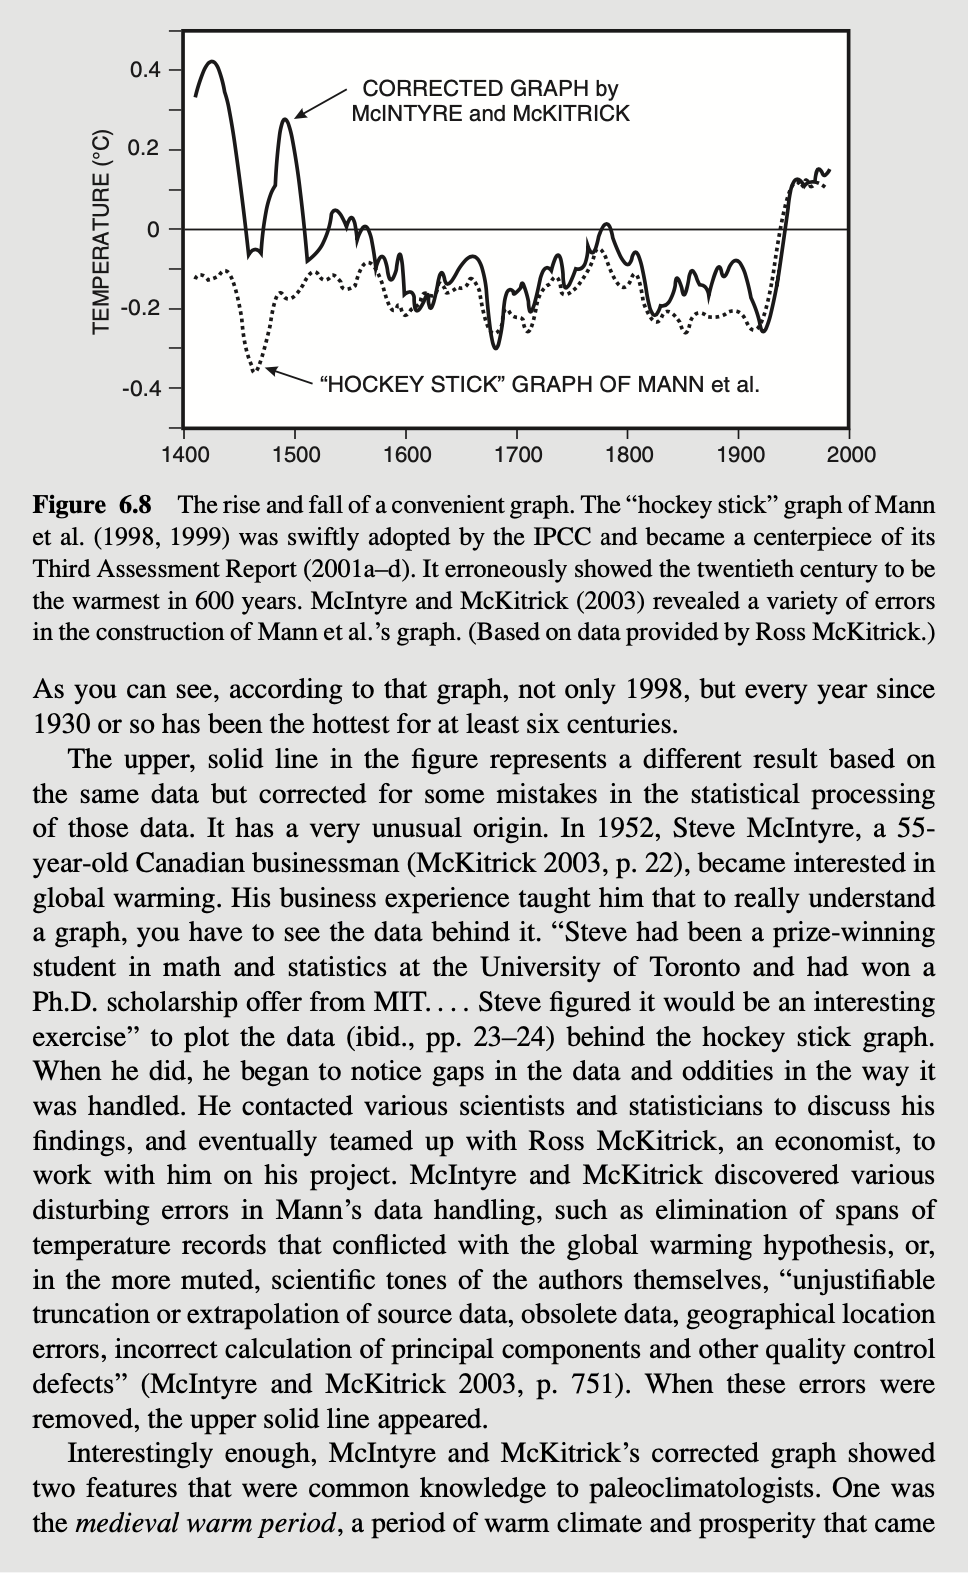
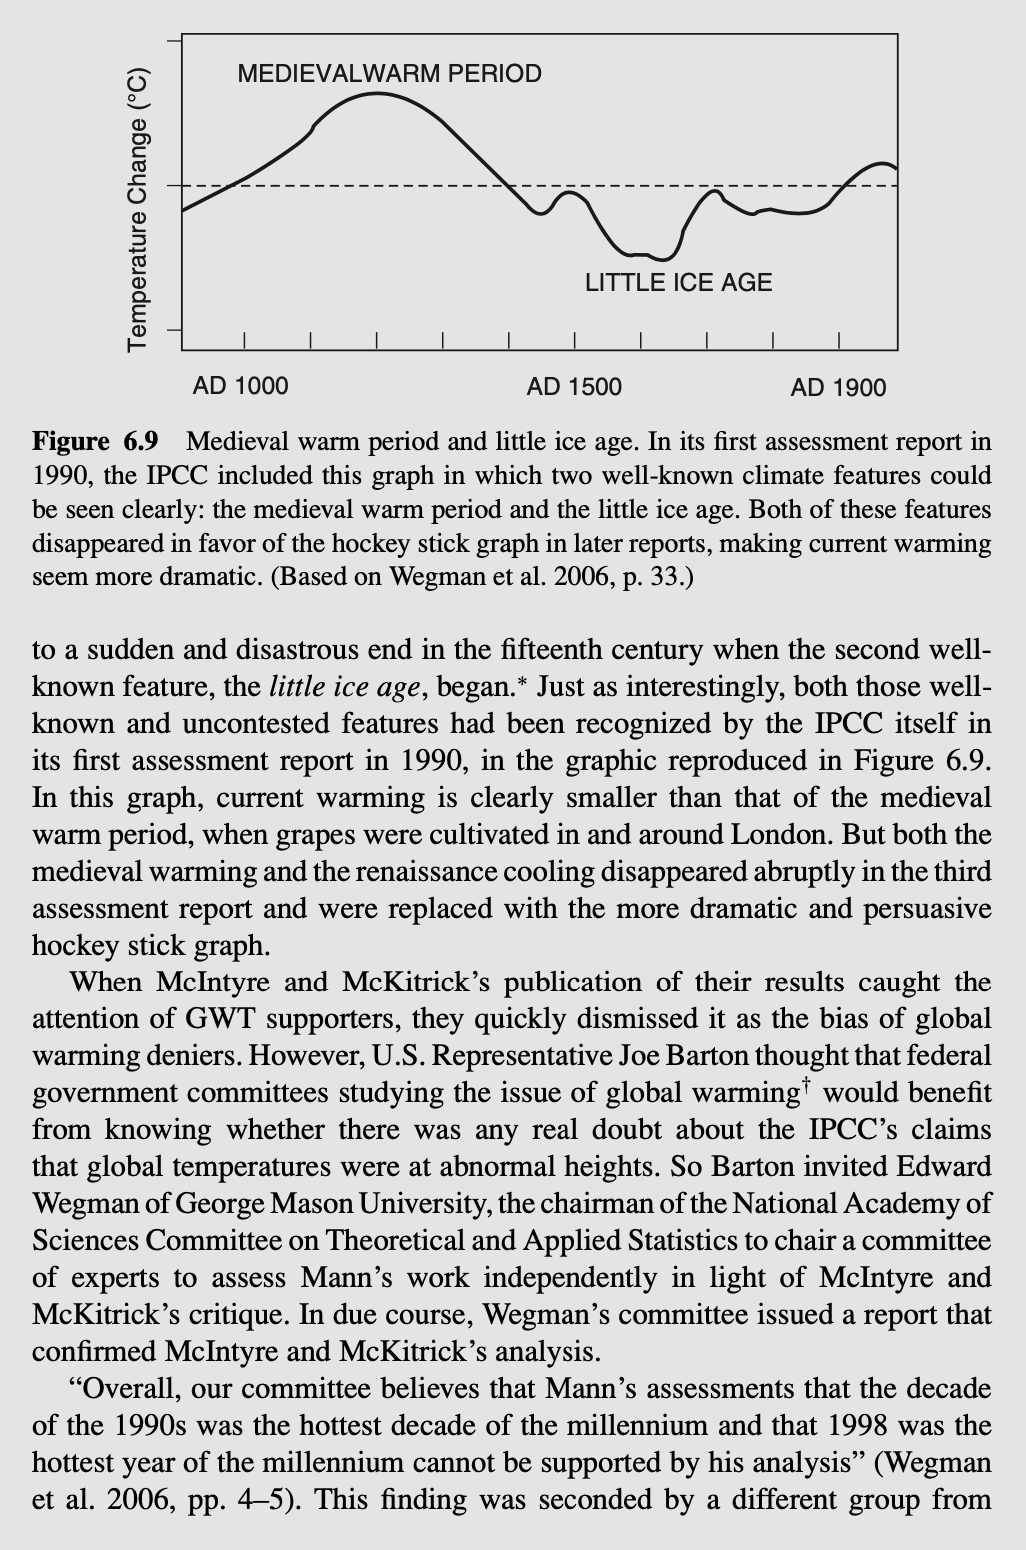
Yes 4: The Link between CO₂ and Temperature. The case for GWT does not rest on multiple feedback models alone. There is a body of evidence that supports GWT directly, regardless of whether MFMs work or not: the correlation between CO₂ and temperature. The strength of this argument is obvious once the data are represented graphically, as in Figure 6.10.36 This is a powerful argument in favor of GWT, so it is no wonder that it figures prominently in IPCC assessment reports and insightful documentaries, such as Al Gore’s movie An Inconvenient Truth (Guggenheim 2006).
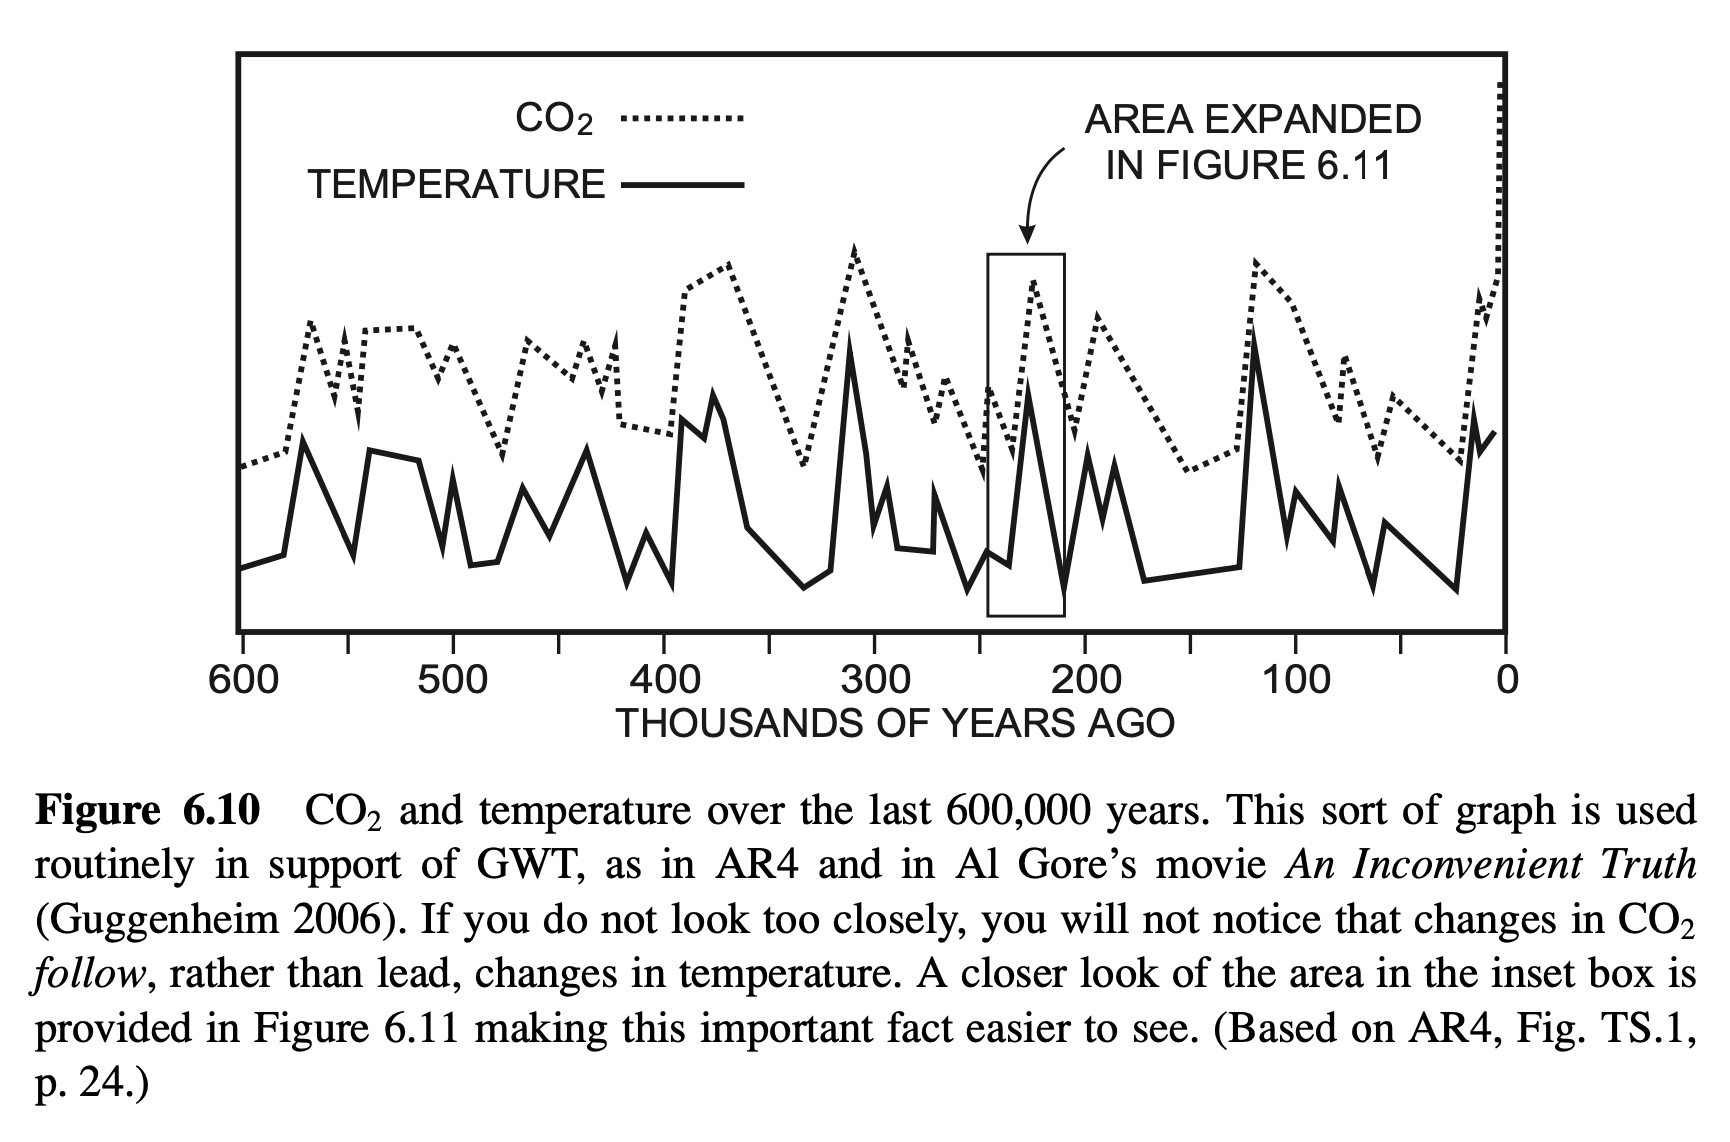
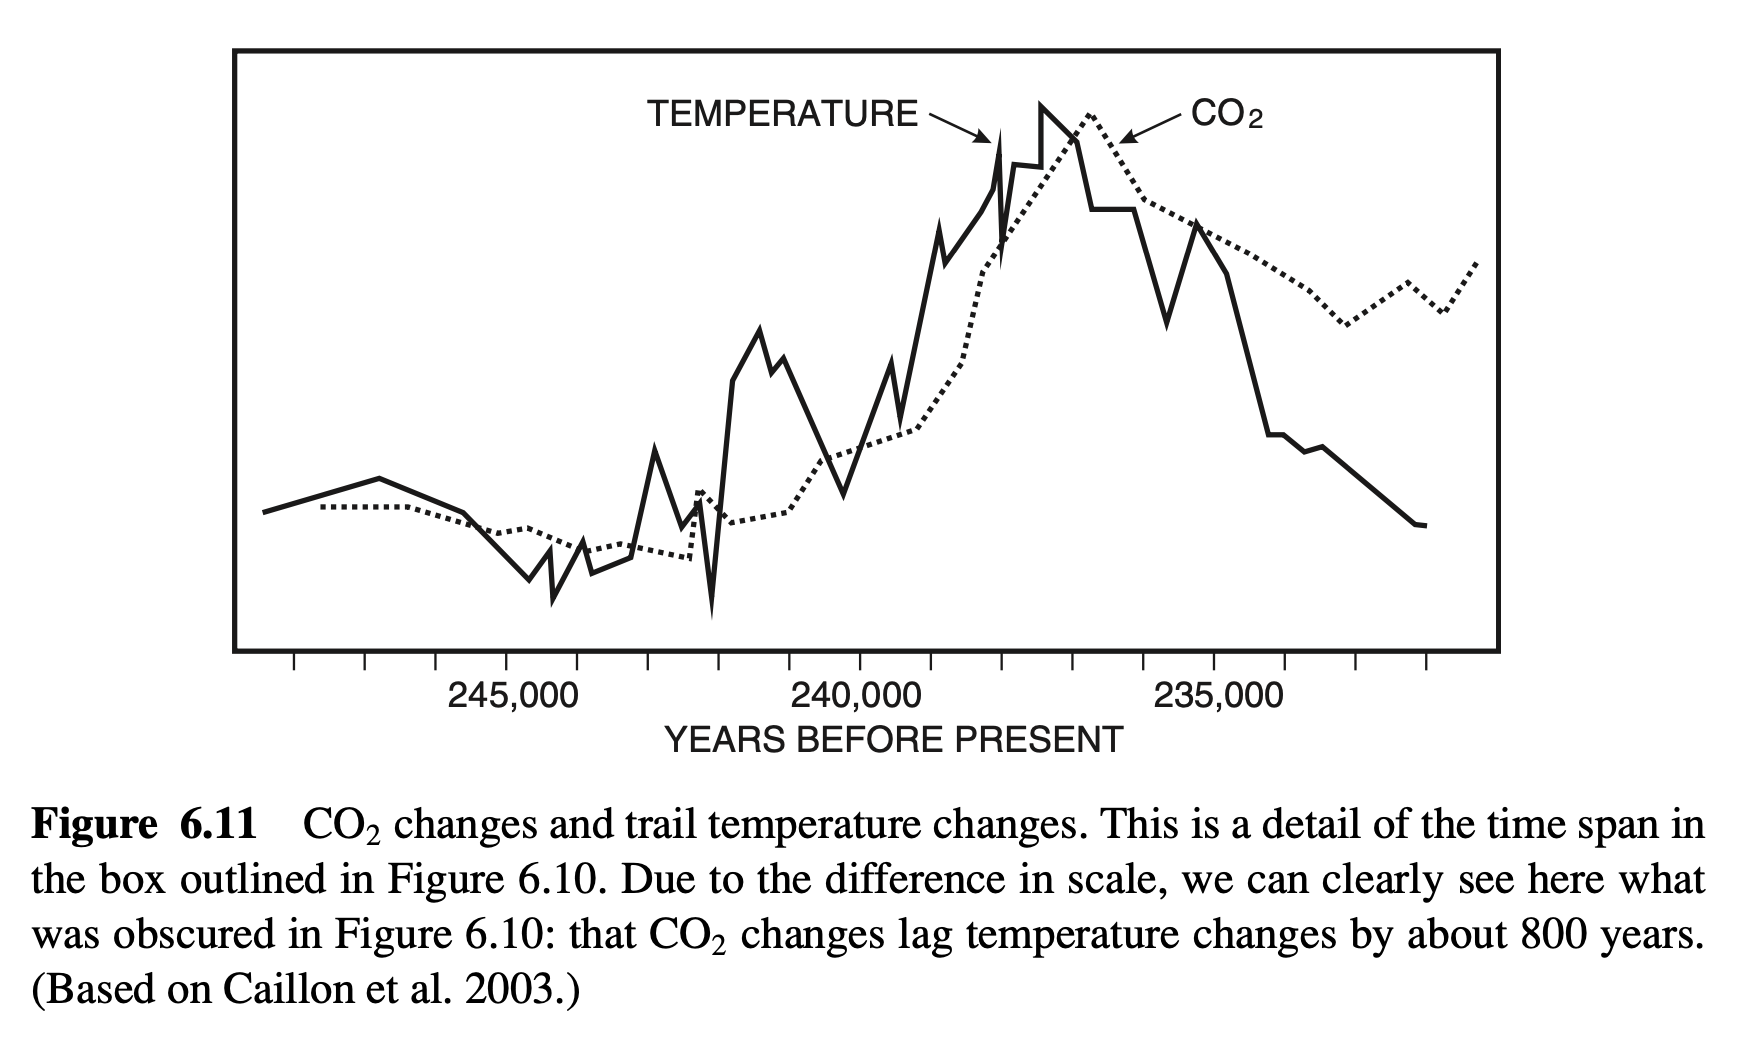
No 4: CO₂ Changes Caused by Temperature Changes. Part of what makes the graph persuasive is its scale: It covers an amazing span of 600,000 years. The scale also makes it impossible to notice that changes in CO₂ follow changes in temperature rather than preceding. Numerous scientific studies using various techniques have shown that when temperature falls or rises, CO₂ falls or rises about 800 years later on average,37 as shown in Figure 6.11.38 This is important because a cause cannot follow changes in temperature. Contrary to the general understanding of GWT, CO₂ is not a climate “driver” that causes major climate changes. Does that mean that GWT is disconfirmed by the CO₂ evidence? No, for GWT can fall back on the claim that CO₂ is merely a climate “enhancer” that amplifies cooling or warming by positive feedback—which, indeed, is the current stance of the IPCC (AR4, pp. 54–57, 85).
From a logical point of view, however, this changes everything. The hypothesis that CO₂ is a climate driver—that is, that changes in CO₂ cause changes in temperature— had the benefit of simplicity. Data of CO₂ changes consistently followed by temperature changes would nicely support this simple hypothesis, as shown in Figure 6.12A.
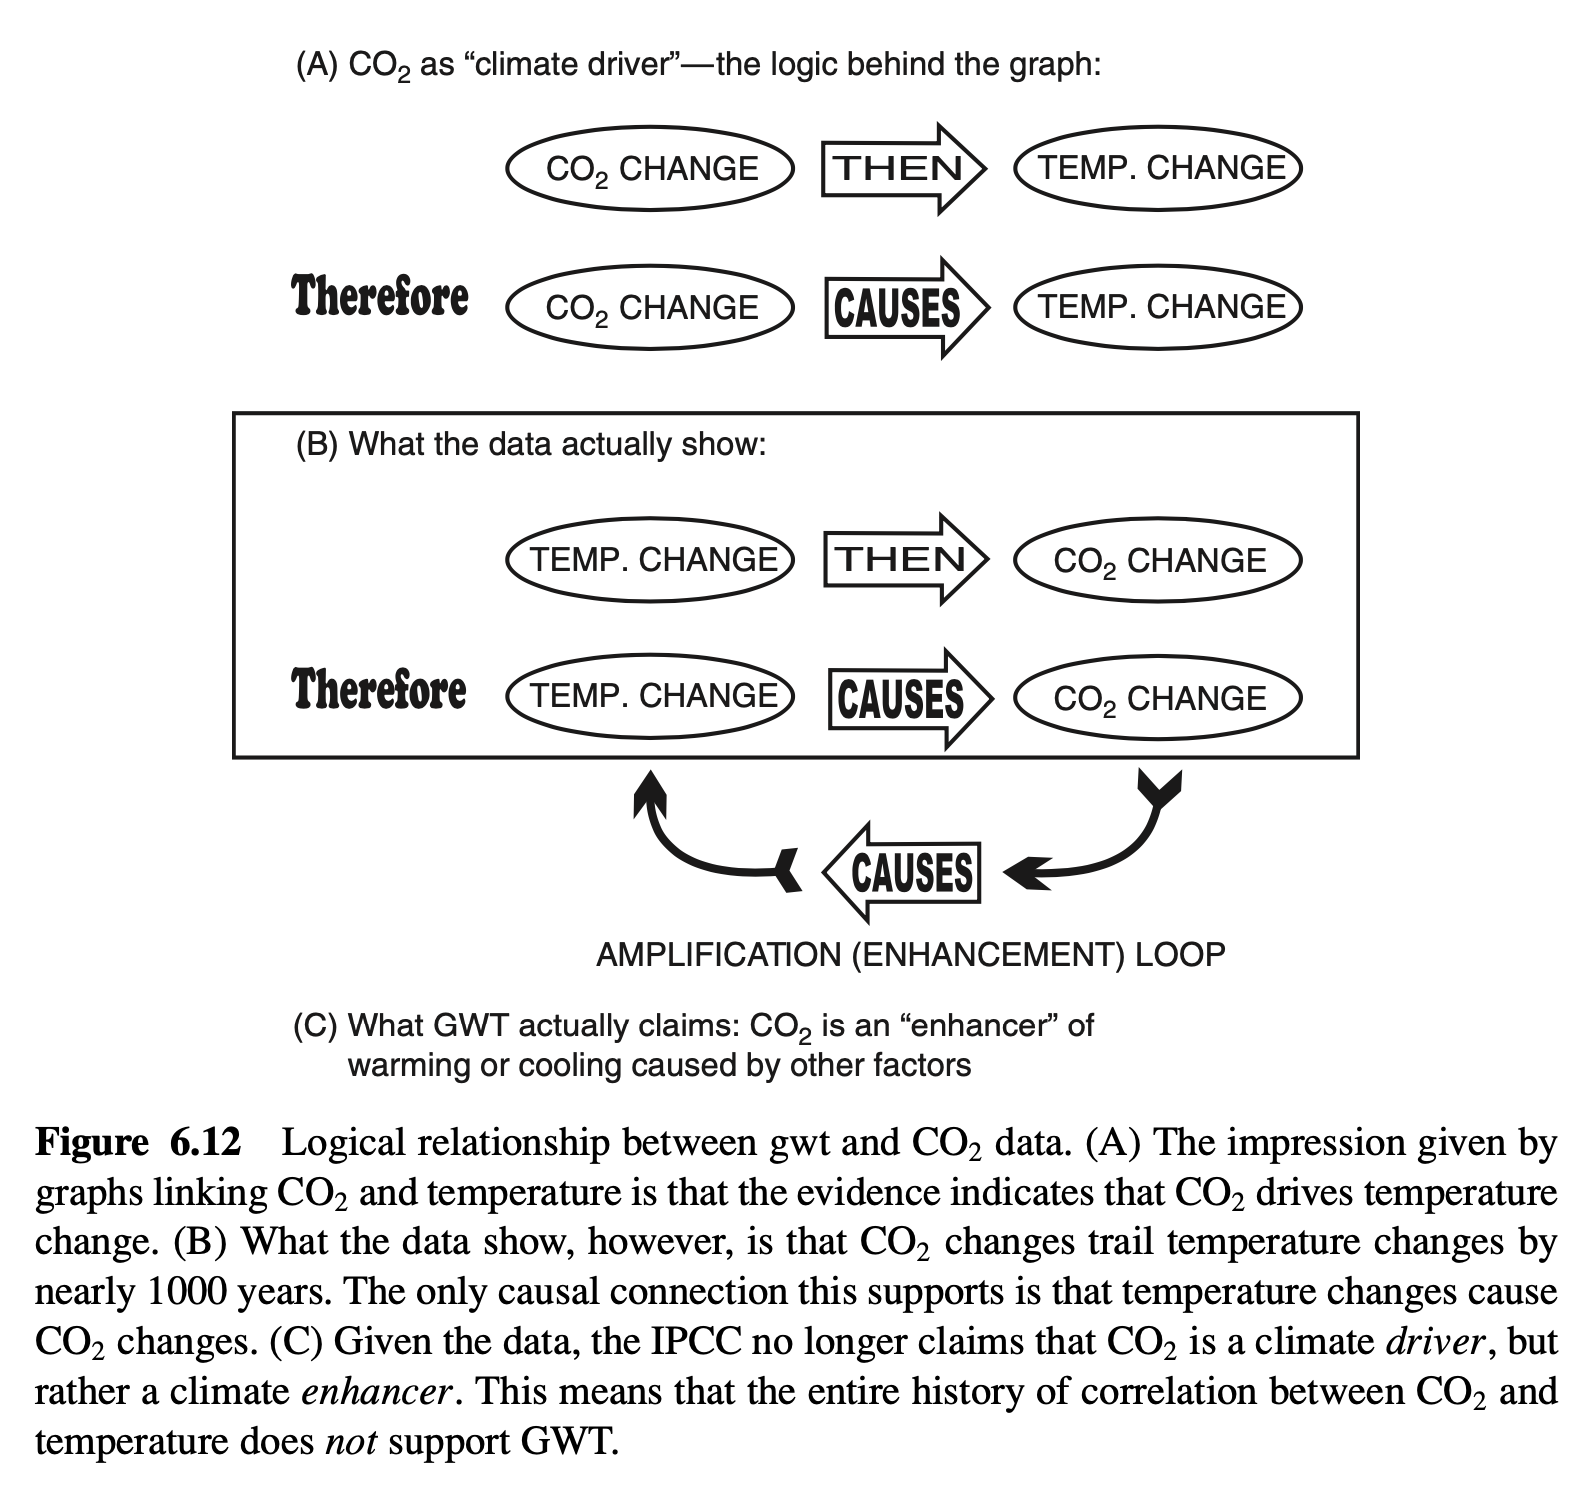
Graphics like the one used by Gore and the IPCC give the impression that the data support a causal linkage from CO₂ changes to temperature changes, as illustrated in Figure 6.12A. But since the data show the reverse sequence, both critics and supporters of GWT now think that temperature change does cause CO₂ change, as in Figure 6.12B.39 GWT supporters have therefore redefined their theory as follows: “Atmospheric CO₂ and temperature in Antarctica co-varied over the past 650,000 years. Available data suggests that CO₂ acts as an amplifying feedback” (AR4, p. 57).
The idea is that warming causes CO₂ stored in the oceans to be released into the atmosphere and cause further warming, while cooling causes CO₂ to be reabsorbed by the oceans and cause further cooling, even though how this happens is not understood (AR4, p. 446).40 The reason that this enhancement hypothesis is accepted is that the authors of AR4 cannot think of any other way to explain the changes in temperature between ice ages and interglacial periods.41 To put it bluntly, a failure of scientific imagination is not the best reason to accept the enhancement hypothesis. In any case, the current position of the IPCC is pictured in Figure 6.12C. Despite the change in terminology from “climate driver” to “amplifying feedback,” the new IPCC position merely insists that CO₂ does drive temperature, despite the inverse temporal relationship. GWT insists that CO₂ drove the very changes seen in the temperature record, at least in large part, even though it followed them. So GWT is an add-on to the causal relationship shown in the data.
The important thing from a logical point of view is that whether or not the enhancement version of GWT is correct, the CO₂ and temperature correlation data do not support the enhancement hypothesis. They support a causal connection in the opposite direction. The hypothesis may be made consistent with the data, but that is another matter—one that will no doubt involve more computer modeling—and one, moreover, that remains to be seen.
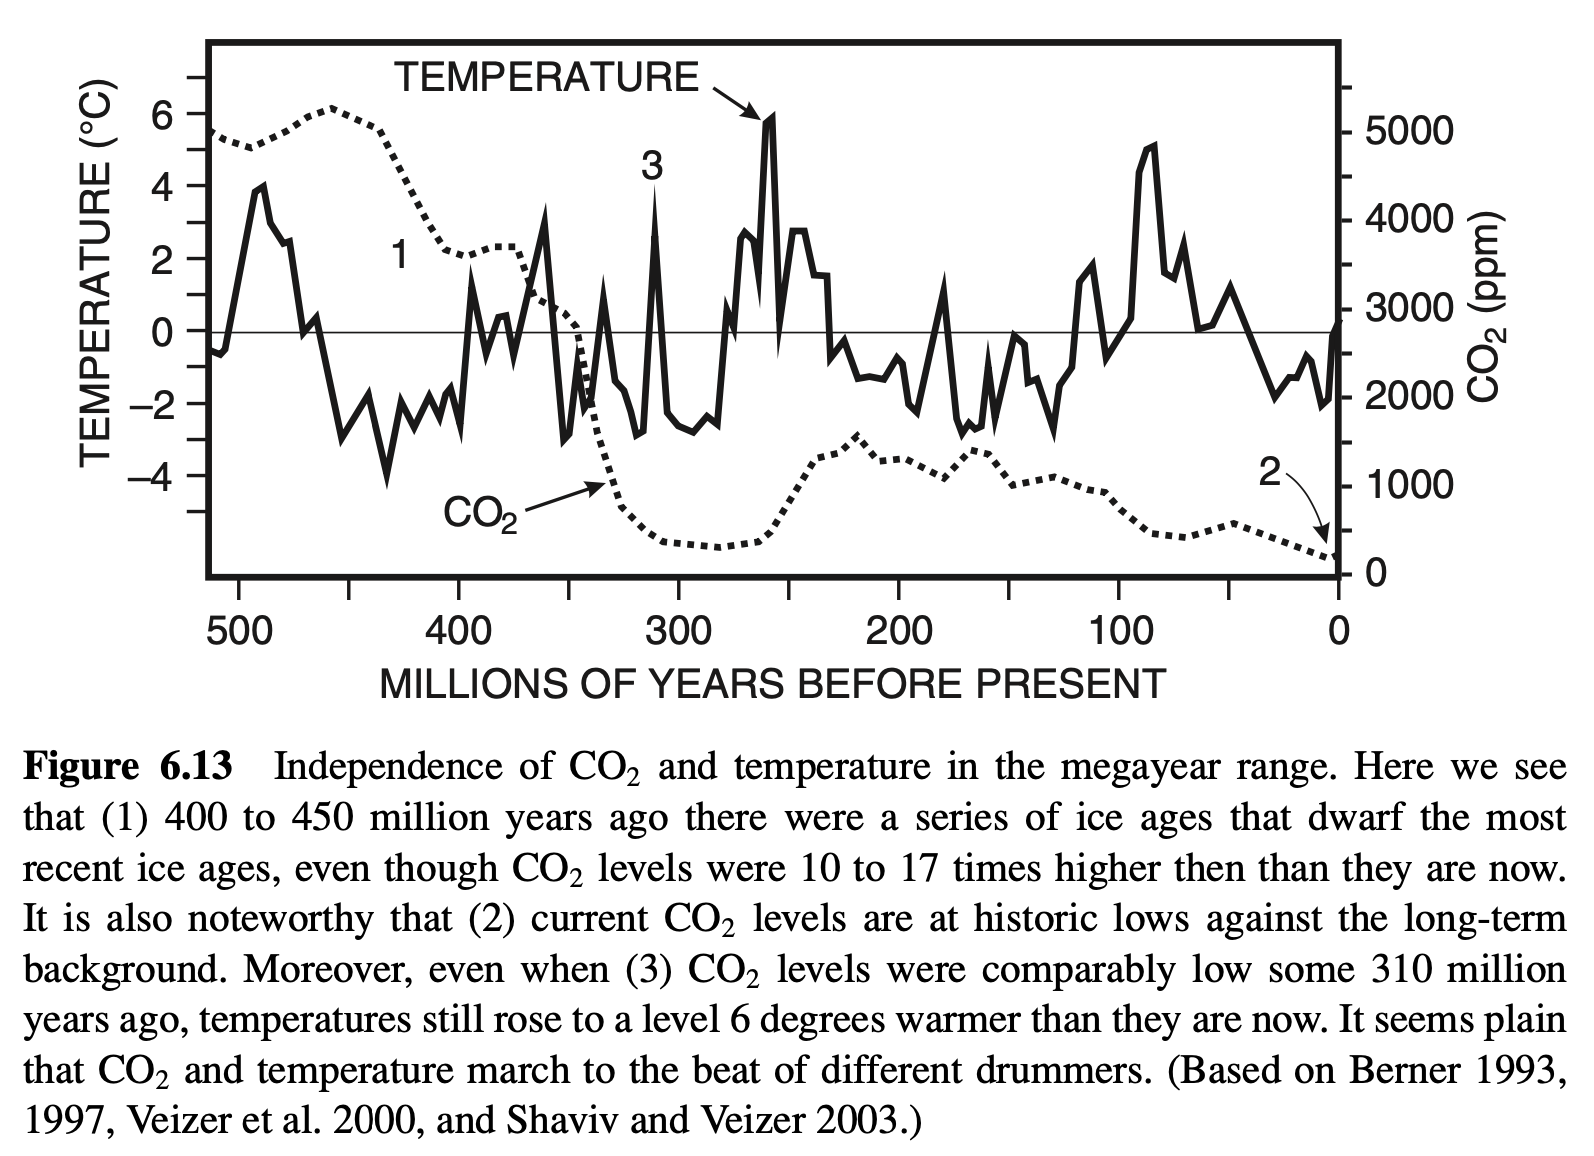
It also remains to be seen whether enhancement GWT can be made consistent with very long term CO₂ and temperature data where there is no correlation between the two to begin with. As various scientists have argued, the long-term evidence seems to favor a decoupling of CO₂ and global climate [see Veizer et al. 2000 or Shaviv and Veizer 2003 for an introduction and references to this literature.] As Figure 6.13 shows, over hundreds of millions years, atmospheric CO₂ has changed by a factor of 17 or 18, while temperature has changed in a way that seems independent of CO₂ levels.
Yes 5: CO₂ Warming Is Massively Amplified by Positive Feedbacks. It is not clear what is indicated by data concerning conditions hundreds of millions of years ago when conditions may have been very different from those we experience today. But if we restrict our attention to the last few hundred thousand years, there is definitely a relationship between CO₂ and temperature. Admittedly, it is not a simple one-way causal mechanism, but that is not a good reason to reject the thesis that CO₂ is a climate enhancer. We must avoid simplistic thinking—and it is here that MFMs have much to teach us.
To begin with, although it is not generally understood by the global public, the effect of increased CO₂ all by itself would be quite small, and no cause for alarm (the media publicizing IPCC conclusions must be forgiven for not drawing attention to this sort of confusing detail of GWT). But in fact, most of the warming predicted by GWT depends on factors that amplify this small CO₂ warming: in other words, positive feedbacks. “According to estimates generated by current climate models, more than half the warming expected in response to human activities will arise from feedback mechanisms internal to the climate system, and less than half will be a direct response to external factors that directly force changes in the climate system” (NRC 2003, p. 1). The IPCC calculates that the effect of doubling CO₂ without any positive feedbacks would be about 1.2ºC, while the full effect given all of the positive feedbacks would be about 3.2ºC, or nearly three times as large (AR4, pp. 630–631). So GWT cannot be understood properly unless MFMs are fully appreciated.
The main positive feedback mechanism is an increase of water vapor in the atmosphere (e.g., AR4, pp. 40, 65, 630). Water vapor is by far the most effective GHG in the atmosphere: It is responsible for most greenhouse heating. Given a small degree of heating by CO₂, for example, the atmosphere warms and so carries more water vapor. This warms the atmosphere further, since water vapor is a powerful greenhouse gas, which in turn leads to more water vaporization, and yet again more heating, in a positive feedback loop.42 The effects of water vapor are not limited to simple positive feedback via its greenhouse effect, however. Increased water vapor also affects clouds and cloudiness, since clouds are made of water vapor. There are as many sorts of cloud feedbacks as there are sorts of clouds. There are puffy clouds, wispy clouds, dark clouds, bright clouds, low clouds, high clouds, daytime clouds, nighttime clouds, fogs, mists, and all the variations in between. Each cloud has both positive and negative feedbacks, and the strength of each depends on various factors, including what is underneath them. Generally speaking, low, bright cumulus clouds have a net cooling effect because their reflection of sunlight back into space outweighs their insulating effect, whereas high cirrus clouds have a net warming effect because their insulating effect outweighs their reflection effect (see Figure 6.6). But the IPCC itself repeatedly says that there exists only a low level of scientific understanding of cloud feedbacks, and admits that “cloud feedbacks (particularly from low clouds) remain the largest source of uncertainty” (2007a, p. 65).
Since, as we have glimpsed briefly above, the dynamics of Earth’s atmospheric blanket are exceedingly complex, it is simply beyond the unaided human brain to calculate or comprehend. Fortunately, computers can be used to model it via MFMs. There are scores of MFMs (called GCMs, or AOGCMs if they include not only the atmosphere but the oceans as well),43 each of which can be run dozens of times with slight variations in its inputs in order to tease out the effect of any one factor (e.g., CO₂, water vapor, clouds).44 When the results of these hundreds of runs are averaged out, we get a picture of how our climate will change under various scenarios. So despite the uncertainties, we may safely conclude that the net effect of clouds is a significant positive feedback.45 Thus, both water vapor and clouds are positive feedbacks to CO₂ warming. So we have every reason to believe that anthropogenic CO₂ will cause dangerous warming. GWT is thus on very solid ground.
No 5: MFMs Fail with Water Vapor, Clouds, and Convection. It is easy to sing the praises of MFMs, but they are beset with problems. When these problems are tallied up, we must conclude that MFMs are still at an elementary stage. At this point they are simply too immature and unreliable to be the basis on which to wager the global economy.
One demonstration of this was the problematic discovery (discussed in No 3 above) that Earth’s radiation balance shift toward increasing heat loss between1985 and 2000 was not only unforeseen by MFMs, but was basically inconsistent with them. In his commentary on the surprising data, the prominent climatologist Dennis Hartmann said that they “demonstrate just how little we know. . . . The observations are not easily explained with existing climate models” (Hartmann 2002, p. 811). He then notes that “this change is of the same magnitude as the change in radiative energy balance expected from an instantaneous doubling of atmospheric carbon dioxide. Yet only very small changes in average tropical surface temperature were observed during this time” (ibid.). In other words, the changes observed in radiation balance were just as strong as those predicted by GWT, but they had no effect on temperature, contrary to the basic premise of GWT and the MFMs that model it. Although various excuses could be made for the fact that climate models did not predict this result, Hartmann concluded that “it seems more likely that the models are deficient. . . . If the energy budget can vary substantially in the absence of obvious forcing, then the climate of Earth has modes of variability that are not yet fully understood and cannot yet be accurately represented in climate models” (ibid., p. 812; my emphasis). This is not a modest conclusion. To say that MFMs are deficient is to say that the foundations of GWT are deficient.
To see how they are deficient, we need only consider the case at hand. The surprising increase in outgoing radiation involved changes in convection and cloud distribution,46 which, as it happens, are two things that climate modelers agree are very difficult to model. Convection cannot be included in MFMs for two reasons. One is that MFMs have very coarse spatial resolution. The smallest detail they can represent is 100 by 100 km in size, an area of 10,000 km² [just under 4000 square miles)],47 so most weather phenomena are simply too small to be “seen” in MFMs, and so are simply left out. The second reason is that MFMs represent only a structure of radiation thermodynamics; in other words, the entire dynamics of the climate system has been reduced to a system of radiation exchanges between the Sun, the surface, the atmosphere, the GHGs, the clouds, the oceans, and so on. Since convection is not radiation, but, rather, moving masses of turbulent fluids, it cannot be included. In order that the effects of convection on radiation balance not be ignored altogether, they can be parameterized, or reduced to radiation functions that can be modeled in GCMs. “Parameterization is defined by the American Meteorological Society (2000) as ‘The representation, in a dynamic model, of physical effects in terms of admittedly oversimplified parameters, rather than realistically requiring such effects to be consequences of the dynamics of the system,’ ” (NRC 2005, p. 12, my emphasis).
The National Research Council characterizes the parameterization problem as a result of the fact that parameterization is simplification, and simplification entails loss of information. “current representations of unresolved processes in the models tend not to adequately represent our knowledge of the underlying physics” (NRC 2005, p. 3). The resulting physical inadequacy of parameterization creates a degree of looseness, or lack of constraint, in models, which in turn can lead to very discouraging subjectivity in climate modeling: “…physical parameterizations are often viewed as blackbox subcomponents whose knobs, in the form of largely unobservable parameters, can be adjusted at will to obtain some desired result” (ibid, pp. 5–6, my emphasis). In other words, parameterization permits climate modelers to tweak their models to get the results that they want, hence placing little or no check on prejudice and subjectivity. The NRC goes on to explain that because of the empirical looseness of parameterization, the main criterion left to modelers for choosing which parameterization to use is whether it gets the results they desire from their models. “Physical parameterizations, often with large numbers of unconstrained or loosely constrained parameters, are inserted into models and judged largely on the merits of their perceived sophistication and their effect on model performance.” (ibid., my emphasis)48
Put bluntly, the parameterization problem invites subjective judgments of desirability of results to dominate objective observation. To say that large numbers of parameters are “unconstrained or loosely constrained” is to say that GCMs permit climate modelers to move toward whatever results they desire without being hemmed in by observation.
As we saw earlier, water vapor is the most important GHG. It also is the most important radiation and temperature feedback in GWT. Water vapor “amplifies the effect of every other feedback or uncertainty in the climate system” (NAS 2003, p. 21: my emphasis). If a warming force raises temperature, this will raise the amount of water evaporating into the air from oceans, lakes, plants, and soil. Since water vapor is a GHG, this will in turn amplify the warming force. Conversely, a cooling force will reduce atmosphere humidity, and this will amplify its cooling effect. So water vapor magnifies the uncertainties in the MFMs supporting GWT, uncertainties about not only the size, but even the direction, of the other climate forcings and effects it amplifies. GWT holds that water vapor greatly amplifies GHG warming and accounts for about a third of the warming predicted by most models.49 This estimate may be too small50 or too large.51
Parameterization cannot magically transform these uncertainties into certainties. If the uncertainties are included in the parameterization and hence in the MFMs themselves, they will in all probability reemerge in the results of these climate models. Since the effect of water vapor uncertainties is to amplify other uncertainties in climatological data and theory, GWT becomes nonspecific, vague, and plastic.
If the word, plastic, seems a bit over the top, consider the climatological uncertainties about clouds. The IPCC claims that clouds will increase and thereby increase global warming.52 Some climatology textbooks, by contrast, teach that the net effect of clouds is cooling. For example: “Water vapor, however, results in cloud formation. Clouds cause a host of climate feedbacks, some positive, some negative . . . , although the overall impact of cloud is to increase Earth’s albedo, and so . . . to cool the planet” (Bigg 2004, p. 5). The NAS sensibly concludes (2003, p. 26) that “at this time both the magnitude and sign of cloud feedback effects on the global mean response to human forcing are uncertain.” In other words, we are uncertain even about whether clouds are a positive or a negative feedback. MFMs cannot magically eliminate this uncertainty, so GWT itself is subject to it.
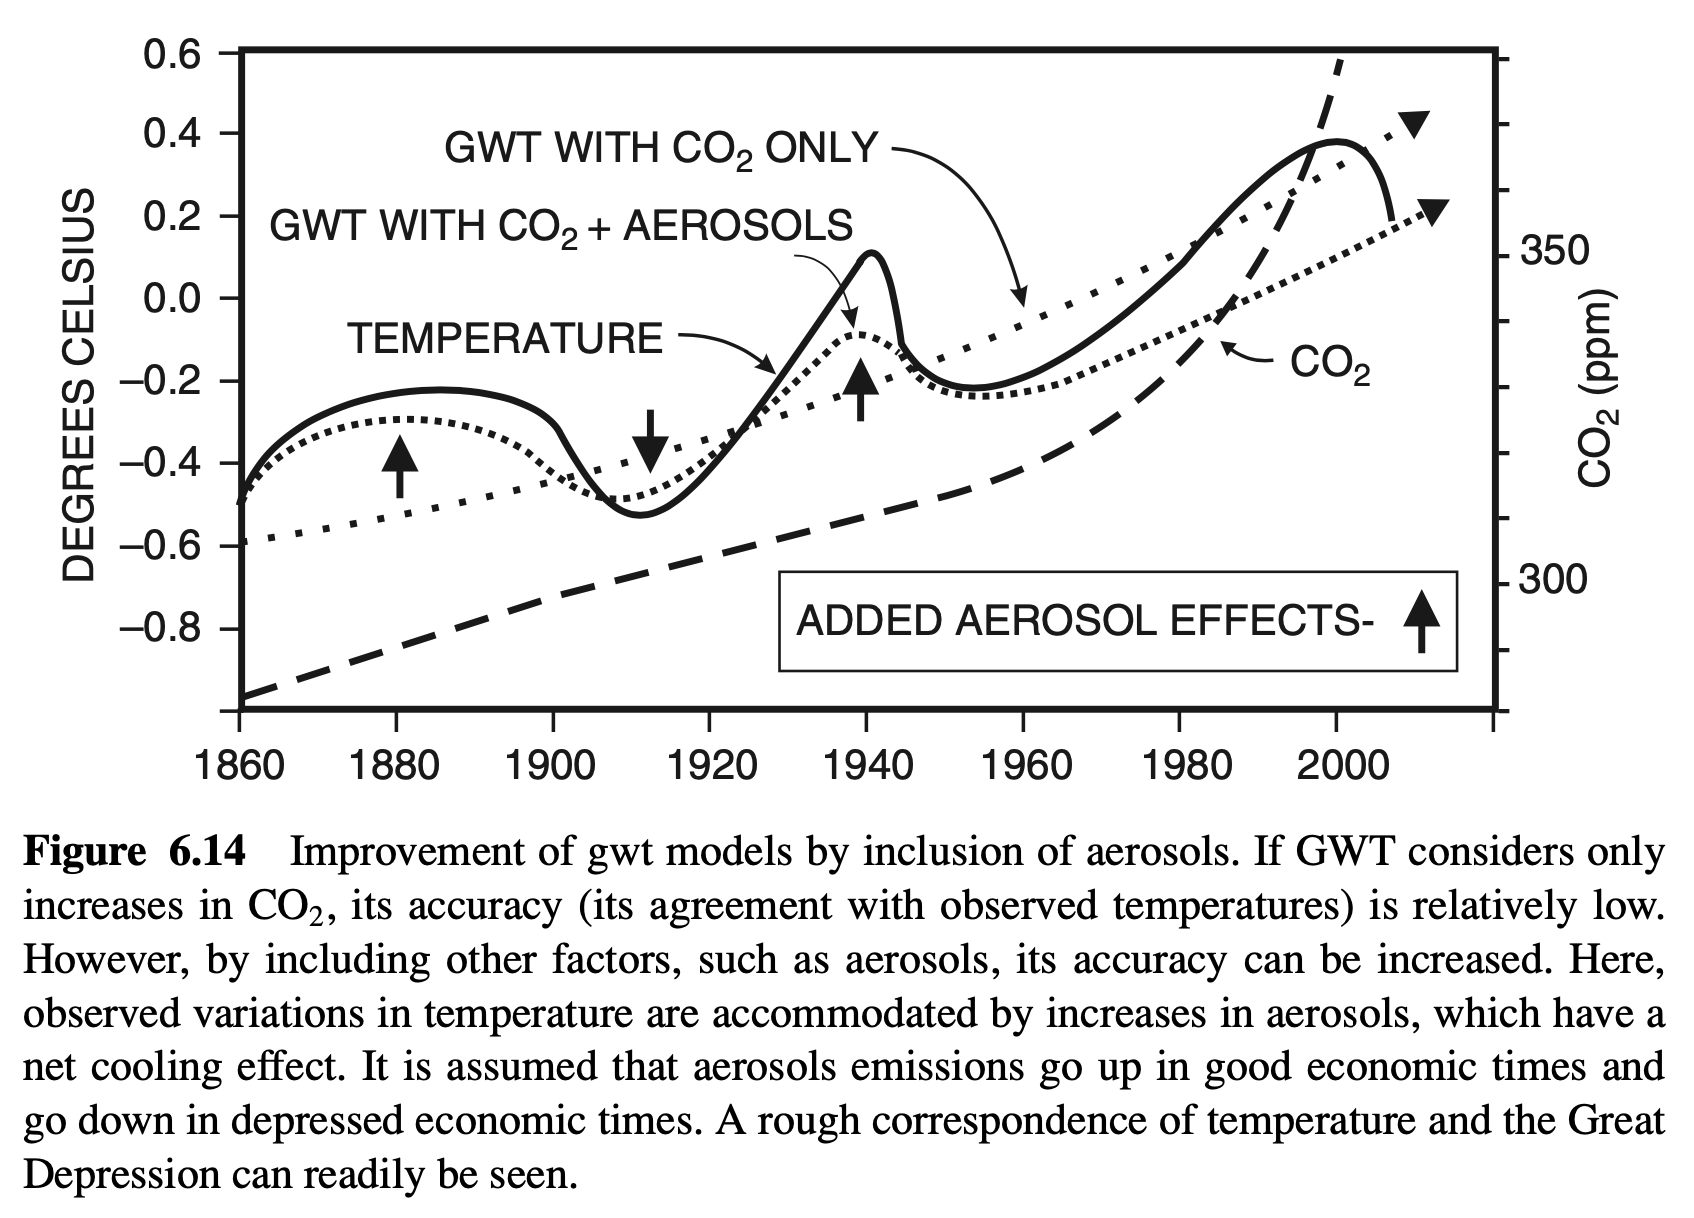
Yes 6: Multiple Feedback Models Explain Recent Temperature Changes. The theoretical reasons for trusting MFMs of GWT are backed up by empirical data as well: MFMs have been successful in accounting for past temperatures. Admittedly, early MFMs did not do very well in this regard. Whereas CO₂ has increased smoothly through the twentieth century, temperatures first fell from 1900 to 1910 or so, then rose for 30 years until 1940, then dipped until about 1970, when they began to rise again, as shown in Figure 6.14.
But as studies through the 1980s and 1990s began to show more clearly that sulfate aerosols had a net cooling effect, the possibility arose of explaining the cooling spells of the 1930s and 1950s in terms of the emissions from industrial smokestacks.53 In those days, smokestack emissions were laden with sulfur dioxide, which turns into sulfate after it is released into the atmosphere. Sulfate cools in a number of ways, which nicely illustrate the complex dynamics of our atmosphere and the complexity of its response to environmental inputs. Sulfate’s direct effect is to reflect some incoming sunlight back into space, a cooling effect. It also causes the low, bright, cumulus clouds, which have a net cooling effect, to become even brighter (by increasing the number and decreasing the size of cloud droplets). It may also increase the lifespan of clouds, again increasing cooling. Sulfate and the clouds it affects also reflect heat back toward the surface, but this warming effect is outweighed by its cooling effects. Thus, smokestack emissions explain the cooling and warming spells of the twentieth century. Smokestack sulfur emissions increased during the economic upturn of the 1920s, causing cooling; they decreased during the Great Depression in the 1930s just when temperatures rose, and then rose again during the economic upturn following World War II as temperatures fell again. A touch of irony emerged: The scrubbing of smokestack emissions of sulfur dioxide to stop acid rain that began in the 1970s has actually contributed to global warming since then.
No 6: The GWT Chain Is No Stronger Than Its Weakest Link. The last argument has lost track of the logic of the situation. GWT rests on MFMs, and MFMs are models of the entire climate. In other words, we have no reason to accept the theory of global greenhouse warming unless we understand the climate as a whole. Unfortunately, our knowledge of the climate as a whole has not advanced to the point where we can model the climate as a whole, and this problem is compounded by the fact that our computer models cannot even model what we do know, but have to simplify it by the art of parameterization. Because the climate is a dynamically chaotic system (see Section 6.6), slight changes in measures used by global computer models can have very large effects on their results. In the more measured language of the professional scientist, the MFMs have large error bars for some highly relevant quantities. So even if we suppose that inclusion of aerosols results in an MFM run that yields a perfect prediction of the temperature observed, this would prove nothing. A perfect prediction would be a matter of contingent factors, or luck, since the effects of aerosols are just as uncertain as a host of other crucial climatological factors. A perfect fit between theory and data can be found within the full range of uncertainty of aerosol effects, and an MFM may be adjusted to do so, but that only confirms the plasticity of MFMs.
Since the early days of GWT, some climatologists have been warning that anthropogenic aerosols—tiny particles of dust and ash that human beings release into the atmosphere—are probably more important than the CO₂ we release. The IPCC itself calculates that aerosols have a cooling effect and use that effect to bring their MFMs into closer agreement with temperatures measured in the early twentieth century. On the other hand, they also recognize that there is a very large uncertainty in aerosol effects. Although they do not make the comparison themselves, it turns out that their uncertainty about the effect of aerosols is larger than their uncertainty about the total effect of global warming itself. This is a most remarkable situation from a methodological point of view! Global warming is a very complex theory in which many elements combine to produce a specific affect. These elements are like links in a chain, and aerosols are one of the links. Each link has a specific uncertainty, and the uncertainty of aerosol effects is estimated with “low” confidence to be 2.3 W/m².54 The chain as a whole has a specific uncertainty, which is estimated with “very high confidence” (AR4, p. 31; italics in original) to be only 1.8 W/m².55 Apparently, this chain is stronger than its weakest link.56
The main message of the press releases surrounding the release of the IPCC’s fourth assessment report (AR4) was that science had now made it official: It is now certain that humanity is guilty of causing climate change. But the high level of confidence IPCC imputes to this claim is not supported by the underlying science, which involves a large number of factors that have uncertain effects.
Yes 7: Arctic Warming Is a “Fingerprint” of GWT. There is no doubt that there has been a dramatic warming of the Arctic over the last few decades. Depending on the estimate, the Arctic is warming anywhere between twice and four times as fast as the tropics (see, e.g., AR4, p. 37). We have all seen the pictures of melting Arctic ice; we have all heard that the legendary Northwest Passage may soon provide another sea route around North America; and we have all heard that polar bears face extinction due to the shrinkage of polar sea ice. This more rapid warming of the Arctic in conjunction with a slower warming of the globe as a whole is just what we would expect according to GWT, as shown in Figure 6.15.
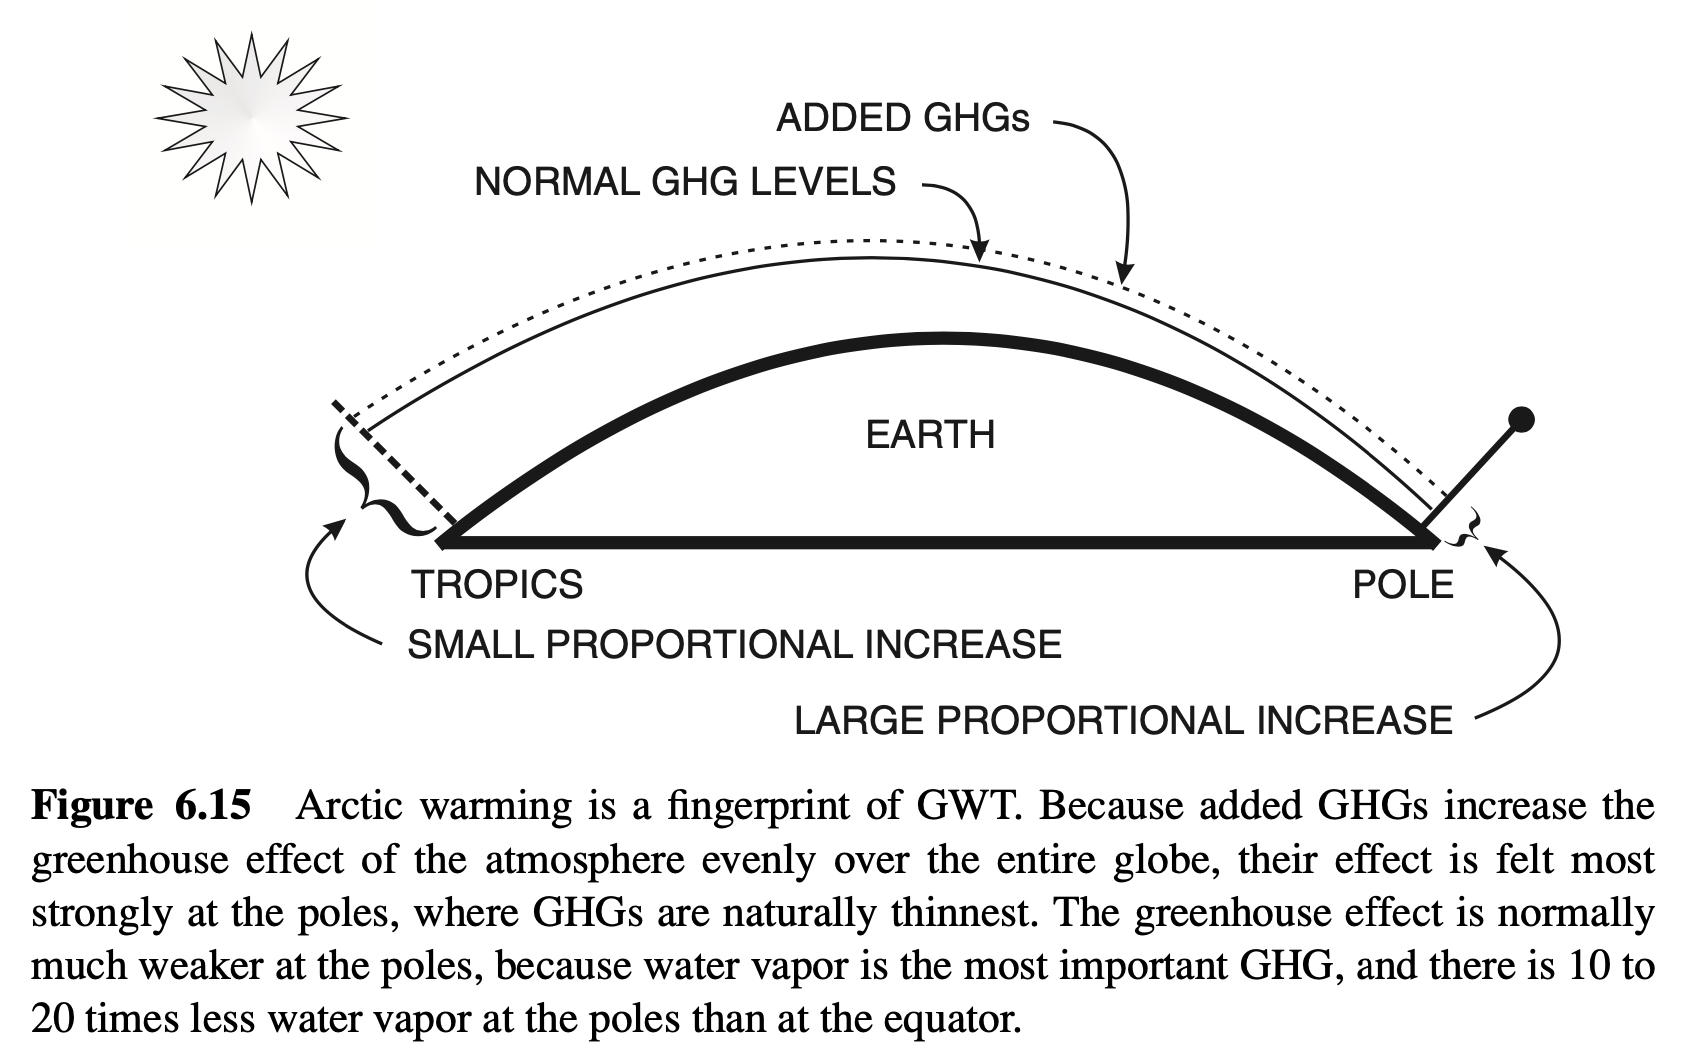
Arctic warming is particularly significant because it is a uniquely identifying fingerprint of the sort of warming we should expect from increased GHGs. Whereas there are lots of ways in which global temperature may be made to rise (and hence lots of ways that such rises may be modeled), the sort of warming required for GWT will have specific characteristics, or “fingerprints.” Arctic warming is one fingerprint effect of GWT. The greenhouse effect of our atmosphere is naturally smaller at the poles than at the equator, since the warmth of the Sun at the equator vaporizes lots of water vapor, and water vapor is the most abundant and effective GHG. In fact, there is about 10 to 20 times as much water vapor at the equator as at the poles.57 Since the greenhouse effect at the poles is small, a small uniform increase in the blanket by the addition of GHGs will have a larger effect at the poles than at the equator.
No 7: The Arctic Warming Fingerprint Is Smudgy. The clearest sign that the Arctic fingerprint argument is in trouble is that the IPCC itself has backed away from it. The argument was presented in the Third Assessment (IPCC 2001a) and is still prominent in arguments presented to the public. For example, in a recent article in the New York Times entitled “Arctic Melt Unnerves the Experts,” Andrew Revkin wrote that “Proponents of cuts in greenhouse gases cited the meltdown as proof that human activities are propelling a slide toward climate calamity” (Revkin 2007), although even in his article there are observations that perhaps something other than GWT is required to explain what is going on in the Arctic. In AR4 we find only the following mild statement:
“Arctic temperatures have been increasing at almost twice the rate of the rest of the world in the past 100 years. However, Arctic temperatures are highly variable. A slightly longer warm period, almost twice as long as the present, was observed from 1925 to 1945 . . .” (AR4, p. 37).
So the current warming period is only half as long as another one within living memory. We must commend the IPCC for making this observation. Why the change in attitude by the IPCC concerning this fingerprint of the theory they believe? Perhaps it is because the GWT warming effect pictured in Figure CS 7.15 actually applies with equal force to both poles. As far as GHG warming is concerned, there should be more rapid warming at both poles. However, IPCC maps of global temperature trends over the last century as well as the last few decades (AR4, pp. 250–251; see Figs. 3.9 and 3.10) show that Antarctic temperatures are not warming much, if at all. If we consult sources other than the IPCC, “one is hard-pressed to argue that warming has occurred” (Chapman and Walsh 2007) at all in the Antarctic. In fact, the most accurate records of temperature, those provided by satellite data (see Figure 6.16), do not show any significant warming in the entire southern hemisphere over the last 27 years.
Although the IPCC still argues that global temperatures vindicate GWT, its claims are now nuanced and qualified. Even though GWT stands for global warming theory,
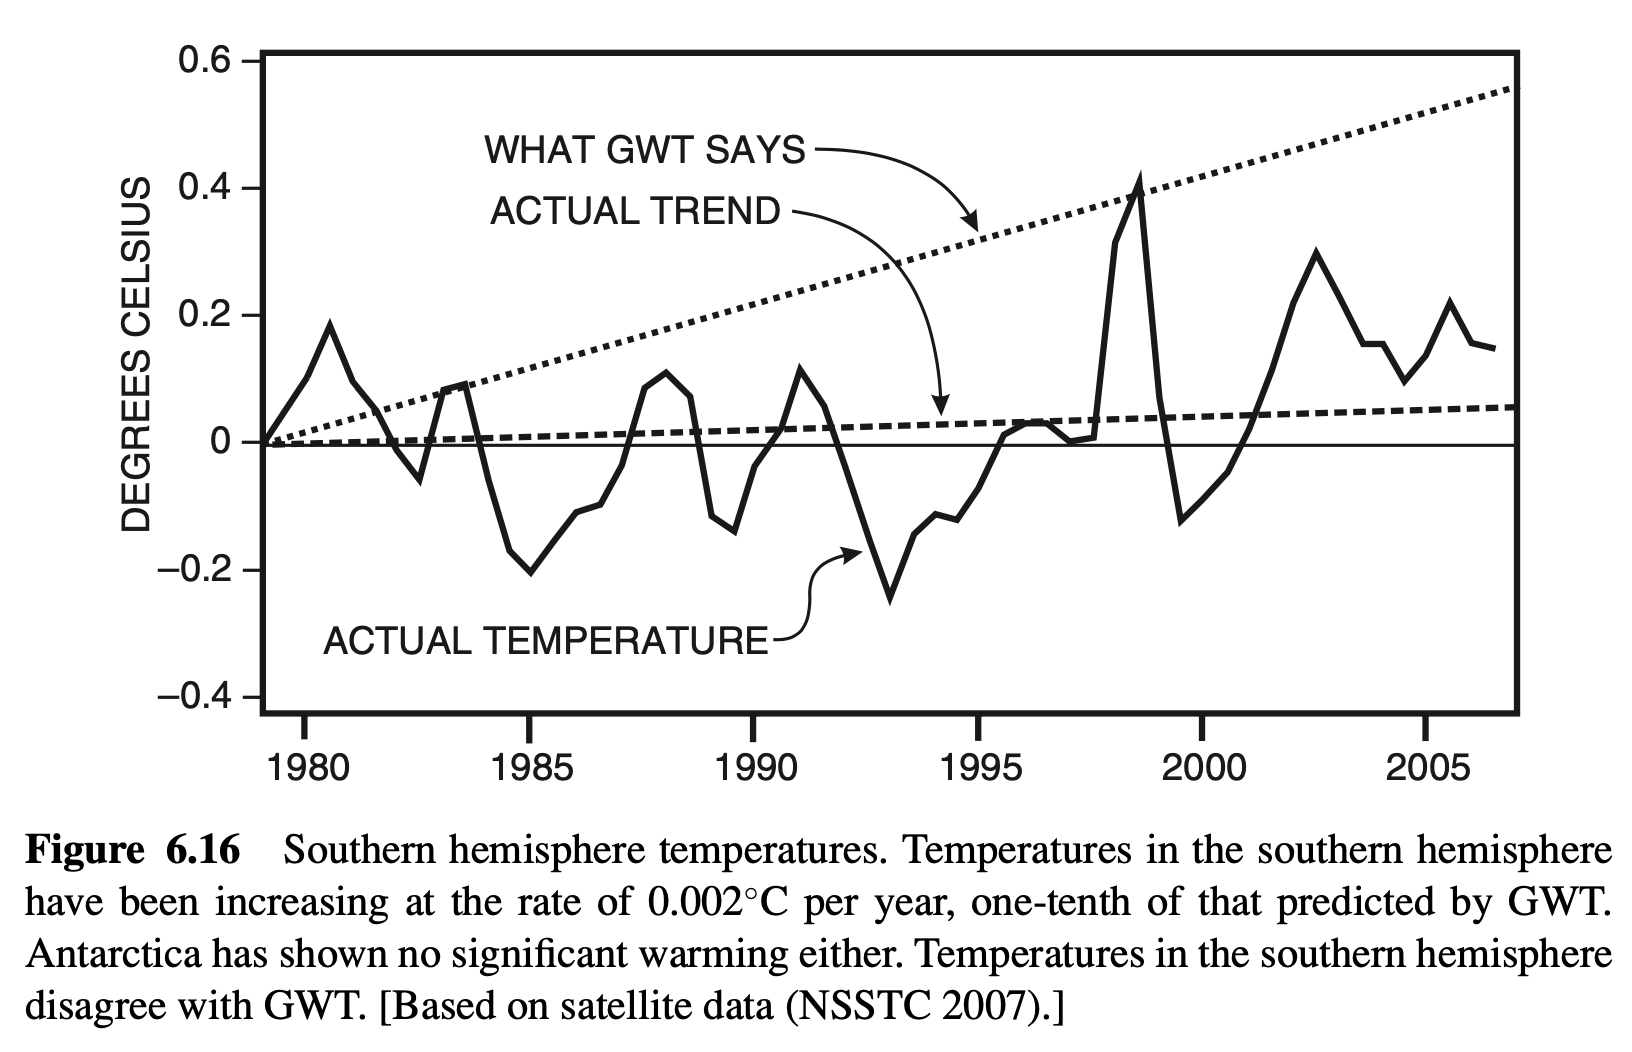
it is now sometimes formally qualified to imply only near global warming: “No known mode of internal variability leads to such widespread, near universal warming as has been observed in recent decades. . . . the response to anthropogenic forcing is detectable on all continents individually except Antarctica” (AR4, p. 727; my emphasis). So even though Arctic warming is still presented as a popular argument in favor of GWT, it raises a problem for GWT: how to explain why warming has been restricted to the northern hemisphere.
Although this Antarctic anomaly is real, it does not seem that in the last analysis it could falsify GWT. There are differences between the Arctic and the Antarctic which may allow the possibility that the first would overreact to global warming while the latter underreacts. For example, the Arctic Ocean underlies most Arctic ice, permitting heat flows via ocean circulation, whereas the Antarctic ice is hundreds of times thicker and lies on solid ground; the Arctic is in the middle of the industrialized northern hemisphere, making it more liable to be affected by industrial aerosols, which often have a short atmospheric lifetime, and do not migrate as readily to Antarctica; and so on.
On the other hand, these admissions and these facts mean that the warming in the Arctic is no longer a GWT fingerprint. For one thing, the warming in the Arctic is much larger than GWT predicts. Ironically, this may be taken by GWT supporters as confirmation, but that would be methodologically perverse. As Stroeve et al. put it (2007, para. 1) “none or very few individual model simulations show trends comparable to observations” when it comes to the Arctic, and simulations are “confounded by generally poor model performance” when it comes to the Antarctic. GWT cannot be treated as a plastic hypothesis, a sort of movable feast for GWT proponents. Either GWT says something in particular, or else it does not. If polar temperatures are not captured in MFMs, this should be taken as a disconfirmation of GWT. If it is not taken as disconfirmation, we must conclude GWT does not say anything specific. So while the temperatures at the poles may not falsify GWT, they do present it with a dilemma: falsification or vagueness.
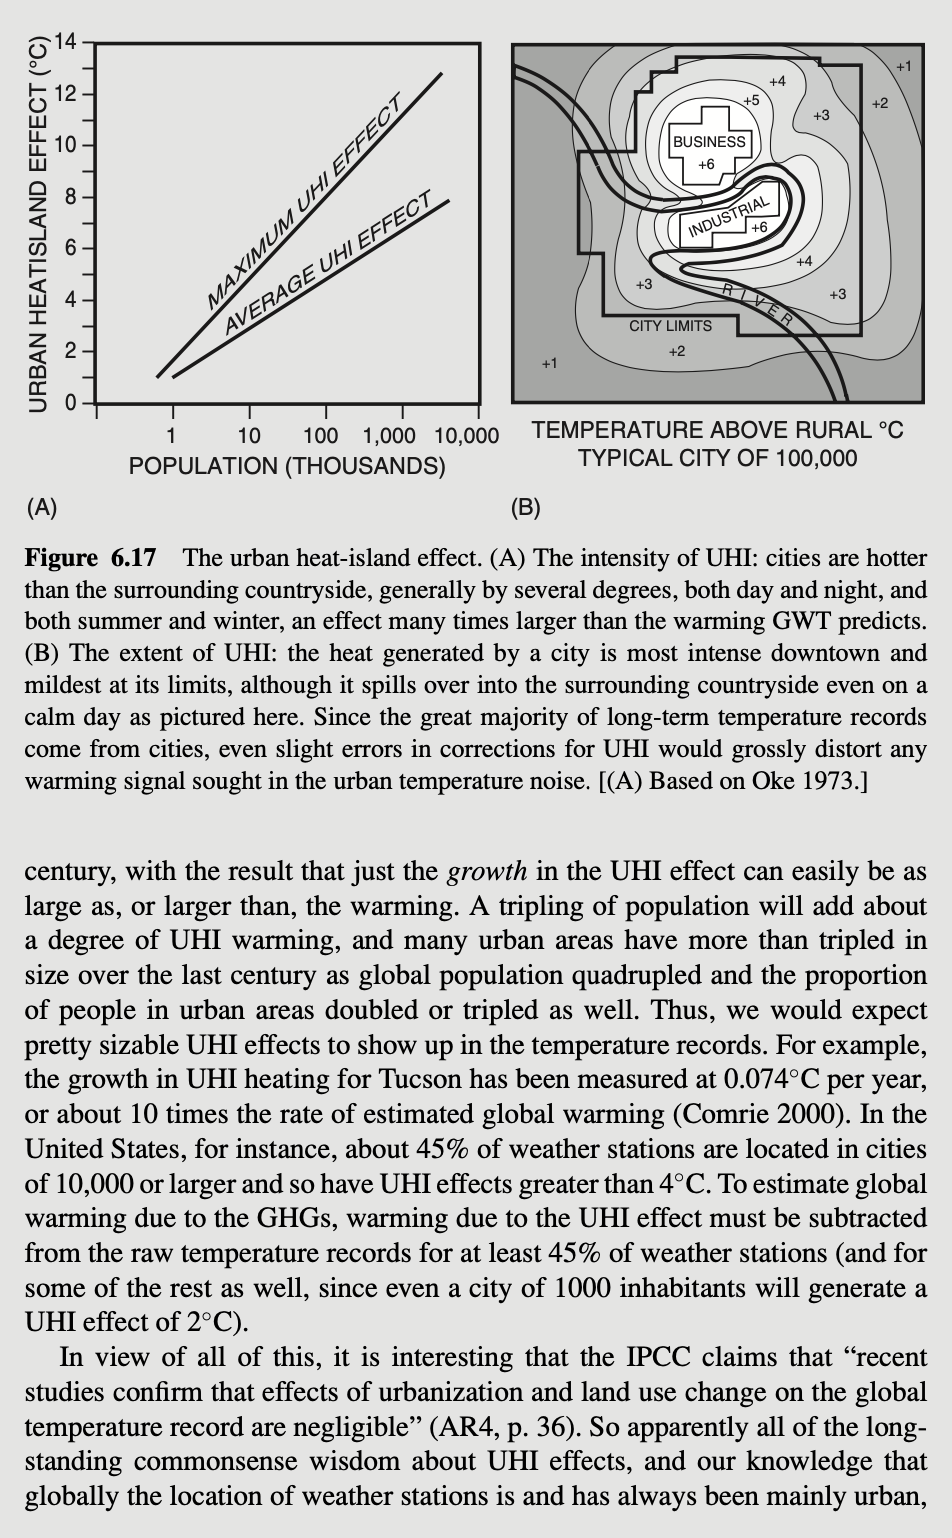
Yes 8: GWT Is the Scientific Consensus, So We Have to Accept It. At the end of the day, nonscientists simply are not in a position to judge whether or not to accept GWT. Scientific theories are sophisticated products of a professional community that are not properly understood by nonscientists. The best nonscientists can do, therefore, is rely on the experts themselves, and they, as it happens, are in favor of GWT. It is interesting and educational to discuss GWT in the pages of a philosophy book, but the question of the actual truth of the theory cannot be addressed properly in this context.
No 8: There Are Strong Scientific Arguments Against GWT. From this it would follow that it would not be proper to address GWT in government either—and that would amount to science dictating public policy. Democracy requires that we rule ourselves, and that in turn requires that we make judgments concerning matters of fact. When it comes to the judgment of the scientific community, only the judgment of scientists is relevant. Scientists must judge whether a theory is strong enough to be accepted as the basis of further scientific research, whereas we must judge whether a theory is strong enough to be accepted as the basis of public policy. Even if scientists are willing to accept a given hypothesis on the grounds that they think its probability of being right is 90%, this probability may still be too low for its acceptance as a basis for action. When it comes to practical action, we must consider what is at stake. We might accept that a given process will produce a safe vaccine as a theory on which to base further research, while refusing to use that vaccine on children until further safety tests are performed. In the case at hand, we have to decide whether GWT is strong enough to wager the global economy on it. It is a weighty decision. So even if there is a scientific consensus, we would do well to question it.
There is, of course, no scientific consensus about GWT. Consensus means complete agreement, and there are qualified and respected scientists who do not accept GWT. Presumably those who claim a scientific consensus for GWT do not under- stand the word in the literal sense, but only claim a strong majority in favor of GWT. It is relevant, then, that no official vote of the scientific community has ever been taken, for it shows that the reported consensus is only an article of faith among those who are already convinced by GWT. George Taylor, 2002 President of the American Association of State Climatologists, reported, “I can tell you that there is a great deal of global warming skepticism among my colleagues . . . the global warming scenarios are looking shakier and shakier” (Taylor 2002). Taylor goes on to reflect on the response of GWT advocates to this skepticism: “It’s interesting to me that the tactics of the ‘advocates’ seems to be to 1) call the other side names (‘pseudo scientists’) and 2) declare the debate over (‘the vast majority of credible scientists believe . . .’)” (ibid.). He also encourages discussions just like this case study: “I’m grateful for those who . . . keep the dialogue open and allow us to share relevant information and scientific data” (ibid.).
Perhaps because a purported crisis is vastly more newsworthy than no crisis at all, the popular media has systematically ignored or downplayed scientific skepticism about GWT. They ignored thousands of scientists among the 17,800 who signed a 1999 petition stating “There is no convincing scientific evidence that human release of carbon dioxide, methane, or other greenhouse gasses is causing or will, in the foreseeable future, cause catastrophic heating of the Earth’s atmosphere and disruption of the Earth’s climate” (http://www.petitionproject.org/, 8 September 2008; http://en.wikipedia.org/wiki/Oregon Petition, 8 September, 2008). This remarkable—and remarkably important—event has gone virtually unreported and so has been kept from the global public by the popular media. The Petition Project (or “Oregon Petition”) website currently lists 31,072 signers, including 3,697 atmospheric, environmental, and Earth scientists, 5,691 physicists and aerospace scientists, and 4,796 chemists. Serious doubts have been raised about the qualifications of a relatively small number of signers, but many are stellar scientists, and many thousands are perfectly well respected and well qualified working scientists. Apparently the political organization of pro-GWT scientists under the banner of the IPCC has gained them the popular media status of representing a “scientific consensus.” However, given scientists’ entirely proper professional opposition against submitting science to political organization, it is quite plausible that a petition would be a more accurate indication of their opinion.
Nor has the popular media paid any attention to doubts about GWT raised by established scientific professional bodies, perhaps because the scientists involved did not issue press releases announcing publication of their critiques. At least two books by the august and authoritative National Research Council have been dedicated to criticism of GWT (NRC 2005, NRC 2003). These two books alone have 24 authors, reporting on the work of 46 other specialists, and reviewed by another 15 “chosen for their diverse perspectives and technical expertise” (NRC 2003, p. xi, NRC 2005, p. ix)60—all of whom express principled misgivings about GWT. In support of their work they cite hundreds of scientific publications. I present these numbers solely to dispel the idea so often presented in the popular media that no qualified scientist has any serious misgivings about GWT. This idea, which is propounded by members of the IPCC itself in its press releases and media presentations, is clearly false.
Yes 9: There Are No Credible Scientific Alternatives to GWT. Of course there are scientists who are critical of GWT, but that is only because the scientific community is a free society that encourages criticism of scientific work in general. It is easy enough to be critical, but no scientific competitor to GWT is sufficiently well supported by data and theory to be as worthy of acceptance as GWT, or even come close. GWT is the only game in town, scientifically speaking. It is the standard against which all competitors are measured–and none of them measure up.
No 9: There Are Credible Scientific Alternatives to GWT. The claim that no opponent to GWT is worthy of belief deserves serious consideration, and the only way to do that is to consider one or more opponents. Indeed, scientific theories should not be considered alone but in comparison to their competitors. So, let us briefly assess just three competitors to GWT: (1) the universal alternative to all theories, the “null hypothesis;” (2) an alternative from inside mainstream climate science, the iris hypothesis; and (3) an alternative from outside mainstream climatology, the Sun–Earth climate connection.
In the interests of clarity, let us define the basis of assessment in advance. As we saw in Chapter 5, scientific models must be assessed relative to their competition (compare item 6, Section 6.3). This assessment has five dimensions:
- Precision concerns how specific the model itself is. A model which says that sunrise will be at 8:11 a.m. (implying precision to the nearest minute) is less precise than one which says that sunrise will be at 8:11 and 34 seconds a.m. (implying precision to the nearest second). Precision does not concern whether or not the model agrees with reality, for that is a question of accuracy, not precision. Precision may be thought of as the standard that a model sets for itself. A model that tries to predict sunrise to the second sets a higher standard for itself than a model that tries only to predict the minute the Sun will rise. Whether either model actually succeeds in meeting its own standard is another question. As we all know, setting a lower standard makes it easier to succeed, and setting a higher standard makes it more difficult.
- Accuracy concerns whether the model agrees with reality. If the Sun rises at 8:11 and 27 seconds, the first model is accurate (it agrees with reality, since 8:11 is the nearest minute to sunrise), whereas the second is not (it disagrees with reality, since 8:11:34 is not the nearest second to sunrise). A model’s precision may be greater than its accuracy, as when a model predicts the precise second of sunrise, but is actually accurate only to the nearest minute. But a model’s accuracy cannot be greater than its precision, since a model that predicts sunrise only to the nearest minute cannot possibly be accurate to the nearest second. As this example illustrates, precision and accuracy are in tension with each other. As a model becomes more precise, it becomes more difficult for it to be accurate. The scientific ideal is for the highest possible levels of both precision and accuracy, but accuracy must often be purchased at the expense of precision, or precision must be purchased at the expense of accuracy. (This use of precision and accuracy is admittedly not in perfect agreement with standard usage, but it will enable us to make distinctions necessary to theory evaluation.)
- Empirical consistency concerns the agreement of the model with the empirical content of other models that are already accepted by the scientific community. This may be seen as a species of accuracy, inasmuch as accepted models presumably are empirically accurate.
- Scope is the extent of application of a model. For example, a model of falling bodies has a narrower scope than a general model of dynamics, which applies not only to falling bodies, but also to projected bodies, bodies in orbit, and so on. Theories of broader scope are preferable, other things being equal, because they give us more information. On the other hand, the more a model says, the more it is exposed to inaccuracy. So scope and accuracy are in tension with each other.
- Simplicity concerns the structure of the model relative to the capacities of the human mind. The purpose of science is to provide us with information about the world in a form that is more accessible than the world itself. The map must be simpler than the terrain, otherwise, we do better just to consult the terrain itself. Given that two theories contain the same amount of information, we prefer the simpler of the two. Thus science aims to find the simple patterns underlying the rich and complex events of the world. Simplicity is in tension with scope. Newton’s mechanics is simpler than Einstein’s, but Einstein’s includes bodies approaching the speed of light, whereas Newton’s does not. We would like to have theories that are both simple and have great scope, but in practice we often have to trade one virtue for the other.
(1) The Null Hypothesis: Natural Climate Variation. The null hypothesis61 is whatever is left when the hypothesis in question is ignored. If we ignore GWT, what remains is the hypothesis that the changes in temperature that we have seen since 1750 are due to natural variation. Climate and weather form a nonlinear, multi-variable system (commonly known as a “chaotic” system), which will unpredictably move away from average values over various periods of time. It is interesting and relevant that deterministic chaos was rediscovered in the 1960s (Henri Poincare ́, 1854–1912, discovered it first nearly a century earlier) by a meteorologist, Edward Lorenz. It is especially relevant that Lorenz was working on computerized climate models when he discovered that they were chaotic. His work eventually led to the conviction that the actual climate system is chaotic: deterministic but unpredictable because of its sensitivity to the slightest change. Lorenz illustrated climate chaos with his famous butterfly effect example: A butterfly flapping its wings in Brazil could set off a tornado weeks later in Texas. Lorenz does not accept GWT because, in his own words, “The atmosphere and its surroundings constitute a chaotic dynamical system, and we cannot without careful investigation reject the possibility that this system is one where spontaneous long-period fluctuations occur” (Lorenz 1991, p. 450).
It is entirely possible that the gradual rise of temperature from 1750 through to roughly 1995 may have been nothing other than such a spontaneous long-period fluctuation, or natural variation (NV). This is precisely what chaotic systems do. For GWT to be established, it must be superior to the NV hypothesis. This has not been shown.
Comparative Assessment. Precision, our first criterion, favors NV over GWT. NV says that at any scale we will find that climate variables change in unpredictable ways (see the box, “Nature Is Unpredictably Wiggly,” in Section 2.1; and Section 6.6). The tests for chaos are well defined and precise, and they have demonstrated to everyone’s satisfaction, including the IPCC, that climate is indeed chaotic. So NV is not only precise but has high accuracy. GWT, by contrast, predicts climate sensitivity (the temperature rise caused by doubling atmospheric CO₂) to be anywhere between 1 and 6ºC, with a best estimate of 3.2ºC (AR4, pp. 65, 630–631), a much less precise claim. Moreover, it has not been possible to check this estimate for accuracy, since no doubling of CO₂ has occurred. When it comes to scope and empirical consistency, NV and GWT are roughly equal: Both apply to climate as a whole, and both are in agreement with accepted scientific theory. However, when it comes to simplicity, they are very different. NV is the simple claim that temperature changes since 1750 are within the range of spontaneous variation of Earth’s chaotic climate. GWT, by contrast, depends on MFMs of the climate system that must mirror its complexity. Thus, NV is vastly simpler than GWT. On grounds of simplicity, we must prefer NV.
Taking all five criteria together, GWT needs to overcome the chaos of the climate system in order to forecast climate with sufficient precision and accuracy that the GHG warming signal that it predicts can be heard against the chaotic background noise of the climate system: an extremely difficult (almost paradoxical) task. At this point all we can hear is noise, which is evidence for NV and against GWT. Every failure of GWT to explain a climate phenomenon counts against it and in favor of NV, such as GWT’s inability to explain the surprising increase in Earth’s outgoing infrared radiation between 1985 and 2000 (see No 3 above), and its inability to explain CO₂ variations between ice ages and interglacials (AR4, p. 446; see No 4 above).
(2) The Iris Hypothesis. In 2001, Richard Lindzen and his colleagues M. D. Chou and A. Y. Hou (hereafter LCH) proposed that there is a natural negative feedback loop that would sharply reduce any warming effect of increasing atmospheric CO₂
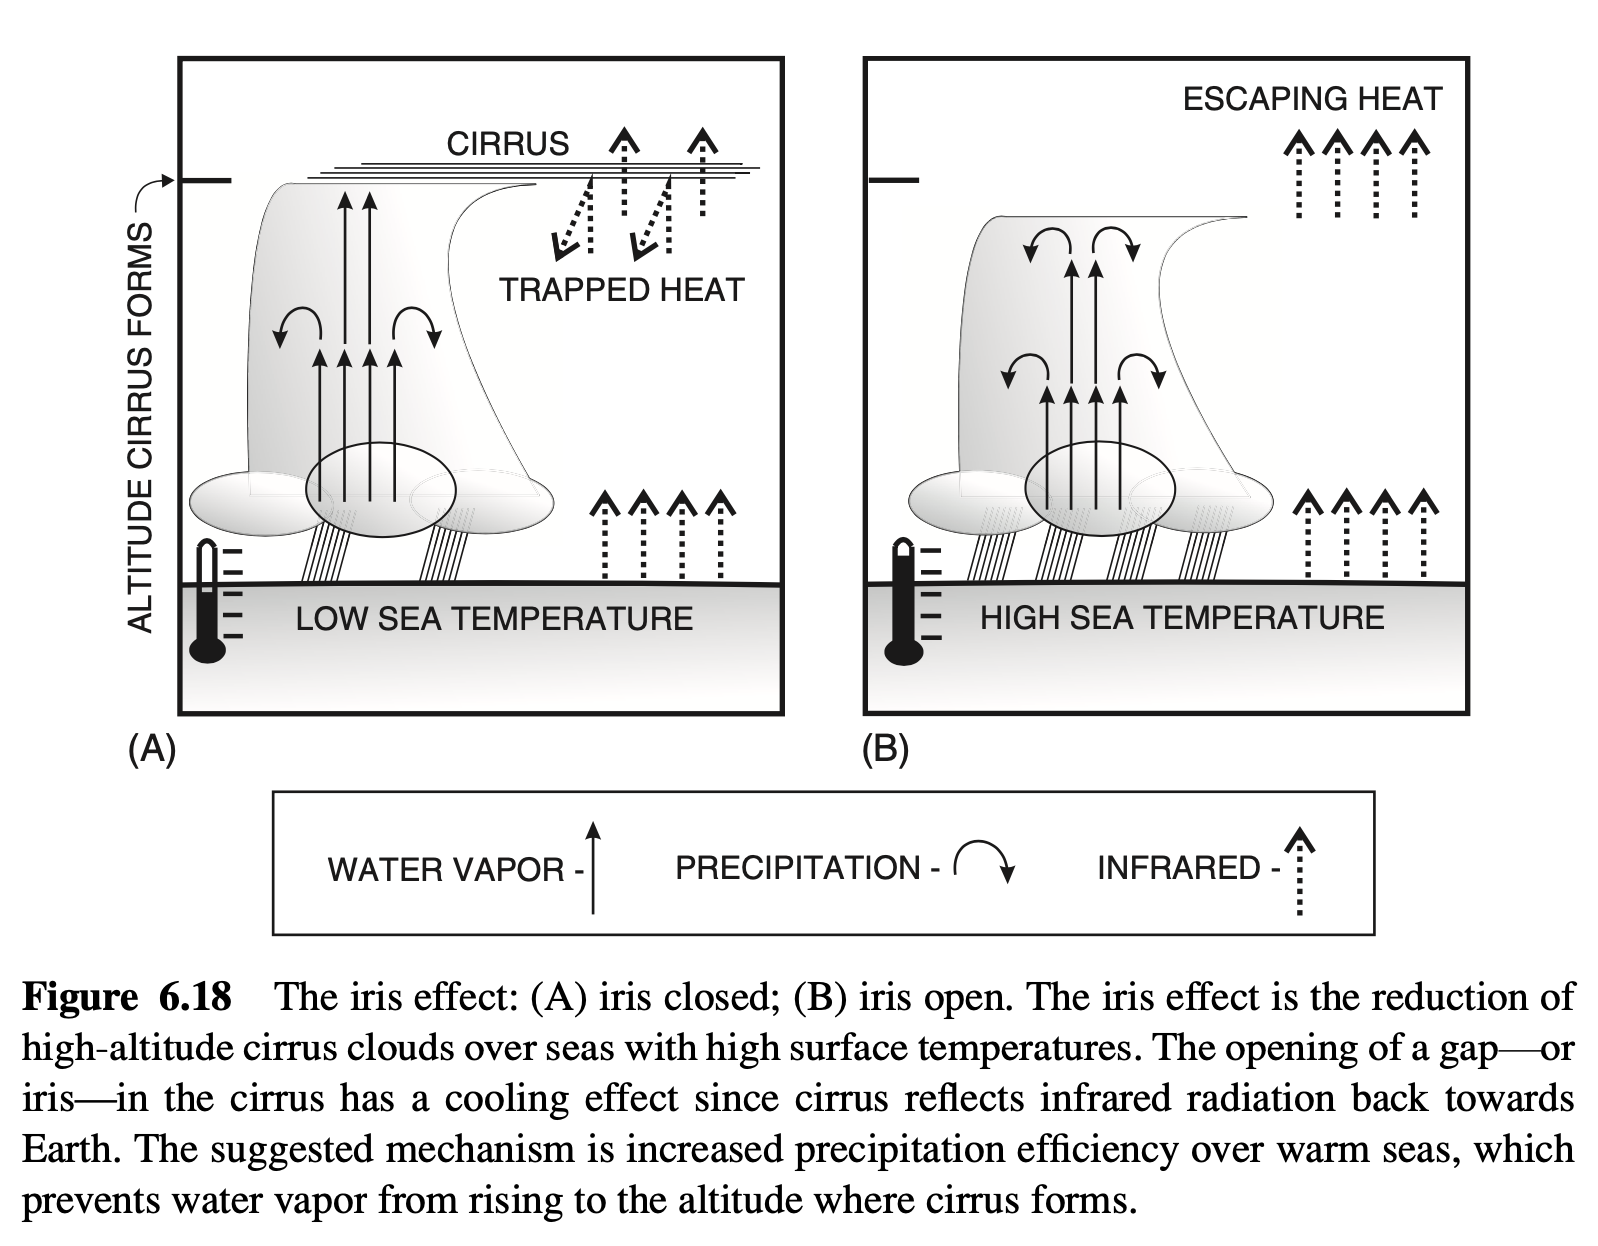
(Lindzen et al. 2001). Their model was suggested directly by observation. As LCH surveyed satellite data of cloud behavior over the western Pacific Ocean, they noticed patterns that made them wonder how cloud behavior was related to the temperature of the water below. When they correlated the satellite cloud data with sea surface temperatures (SSTs), they discovered that fewer high-altitude cirrus clouds form above ocean areas with higher SSTs. Since cirrus clouds have a net warming effect (see Figure 6.6), decreasing cirrus has a net cooling effect. Thus, seas with higher SSTs clear away insulating cirrus clouds above, which in turn cools the seas below. This process is like an iris that responds to ocean heat by opening to permit it to escape into outer space, so LCH called this model the iris hypothesis (IH). LCH declined to specify a detailed mechanism for IH, although they did suggest that the mechanism is increased precipitation efficiency in convection cores (or towers) over areas of higher SST. This causes more of the moisture in the rising air to be removed as rain, which in turn leaves less moisture to rise into the upper troposphere to be “detrained” to form cirrus, as illustrated in Figure 6.18.62
LCH’s climate model indicated that for each degree that the sea surface warmed, the iris effect cooled the entire atmosphere by 0.45 to 1.1ºC—a very powerful effect. Thus, the iris effect would either sharply reduce or entirely reverse the warming predicted by GWT. The iris theory immediately came under attack on a variety of fronts, including its methods,63 the size and sign of the iris effect,64 and the details of the iris mechanism.65 Although some good points were made by its critics, IH remained viable, and the surprising discovery that there had been an unnoticed increase in infrared radiation escaping over the tropics (see Figure 6.7) seemed to be what the hypothesis predicted (Wielicki et al. 2002).66
The latest development at the time of this writing is the release of a study that agrees very nicely with IH. Spencer et al. (2007) employed “high time-resolution (e.g., daily) variations in the relationships (sensitivities) between clouds, radiation, temperature, etc.,” (ibid., para. 4) calculated from satellite measurements in order to resolve the many uncertainties concerning cloud feedbacks in GWT. They studied
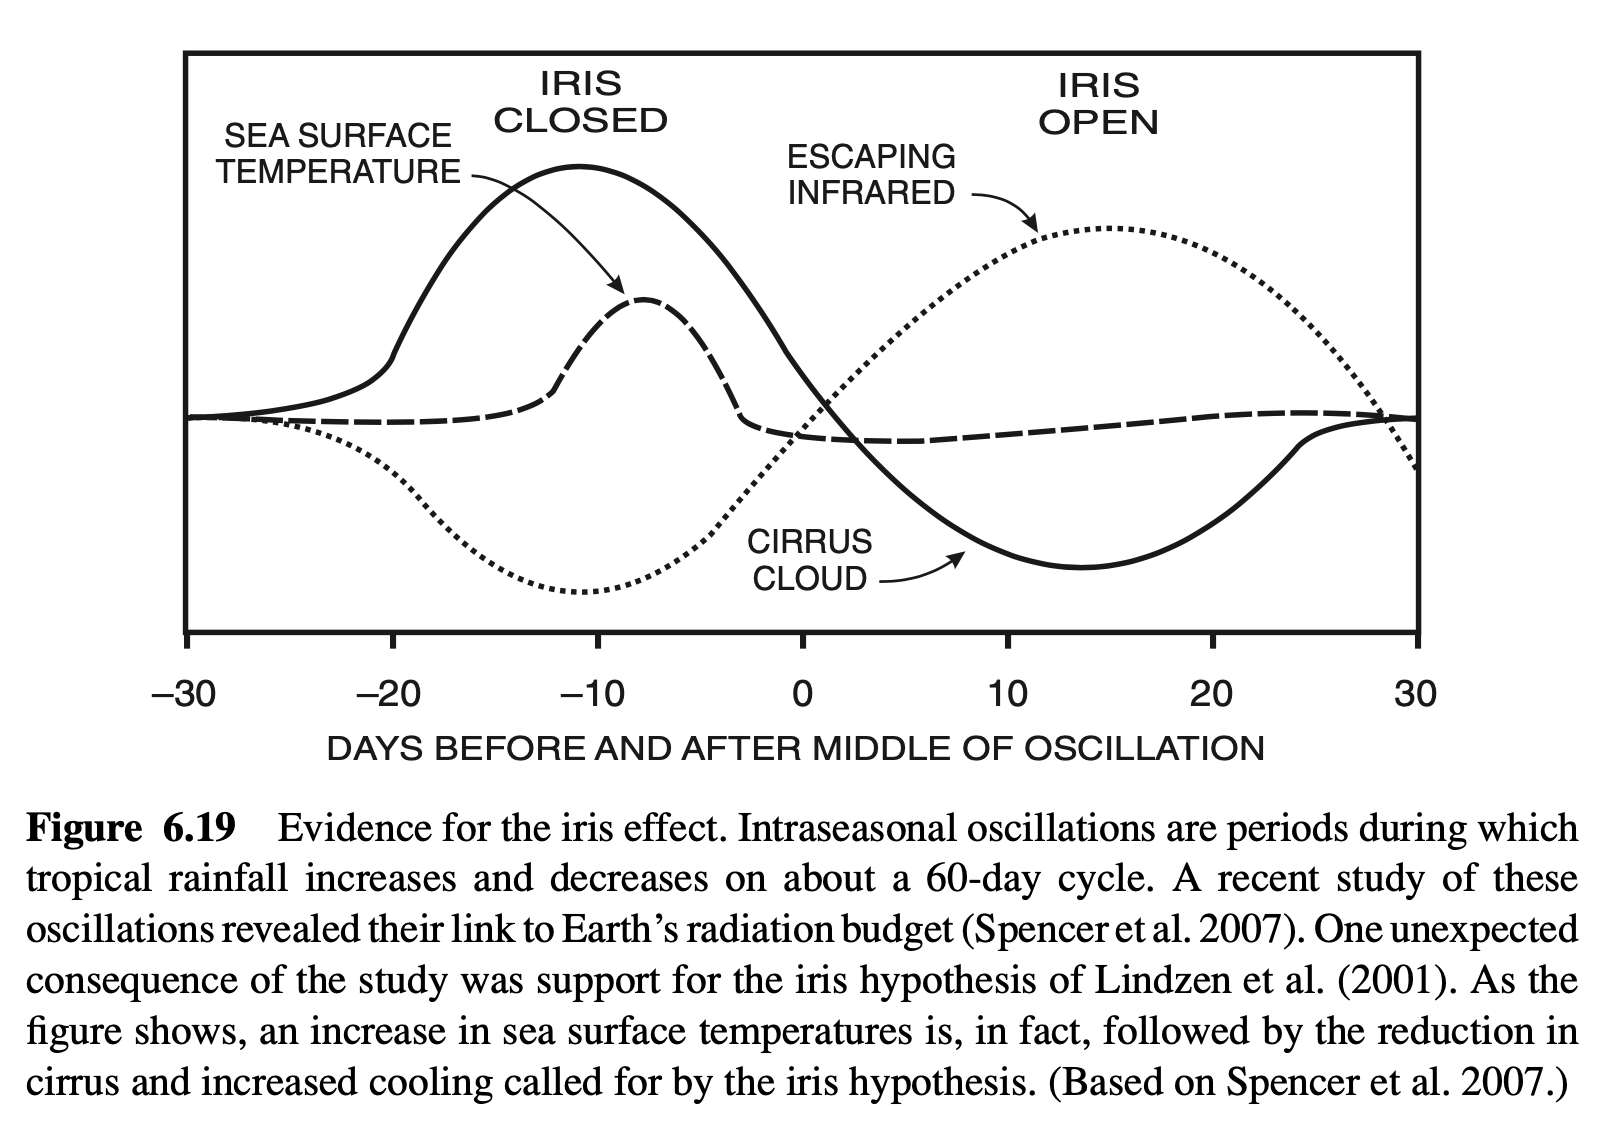
daily variations in clouds, temperature, rainfall, SSTs, and radiation balance, which tend to fall into cycles of about two months, called intraseasonal oscillations (ISOs). A pattern emerged in the ISOs that agrees with IH. First a period of warming (in which incoming solar radiation outweighs outgoing infrared radiation) leads to higher SST, which then leads to increased convection, wind, cloudiness, and rain. After reaching a peak, this pattern reverses, the weather calms down, and the sea cools (see Figure 6.19). The data show that the main agent of this cooling is reduction of high cirrus cloud, just as IH predicts.
Given that this study relies on data from state-of-the-art satellites put into orbit in order to resolve the complex dynamics of cloud feedbacks, these results speak very loudly in favor of the accuracy of IH. Spencer et al. note that their data are “conceptually consistent with the ‘infrared iris’ hypothesized by Lindzen et al.,” but caution that it is “not obvious whether similar behavior would occur on the longer time scales associated with global warming” (ibid., para. 18). The iris effect they have observed is very strong,67 and no account of climate, including GWT, can be considered complete unless it takes it into account.
Comparative Assessment. Our first criterion is precision, and neither model says anything very precise.68 Thus, their accuracy is good, given that they are aiming at wide targets due to this general lack of precision. IH has an advantage with respect to the radiation budget data, which are problematic for GWT (No 3). Whereas GWT requires a net imbalance of incoming radiation over outgoing radiation, IH predicts the opposite when an iris opens. The surplus of outgoing radiation over incoming radiation that was measured and that surprised climatologists (Chen et al. 2002) shows that IH may be correct. Recent measurements by Spencer et al. (2007) are also in favor of IH. Moreover, IH has the potential to explain the absence of tropospheric warming that is so problematic for GWT (considered below, No 10) since irises would cool the troposphere more efficiently than the surface since they open just above the troposphere. So IH currently has an advantage when it comes to accuracy.
When it comes to empirical consistency, there is little basis for preferring one theory over the other. Both models are in their childhood, and their general lack of precision is due to the great difficulty of meteorology and climatology. As we noted in Chapter 5, climate is a complex, in fact chaotic, system, so we cannot expect the same levels of precision in this domain as in simpler physics or chemistry. Thus, the well-known empirical facts of simpler sciences such as physics and chemistry do not sufficiently constrain climate models to make one preferable to another. Both GWT and IH are venturing into uncharted waters.
However, the difference in scope between the two hypotheses is enormous: Whereas GWT is a model of a global process involving the entire climate system over a few centuries, IH is a model of a process over the tropical ocean over a period of a few weeks. Other things being equal, we prefer a model of broader scope, because it says more than a model of narrower scope—but by that same logic, a model of such massively ambitious scope as GWT has so much more that can go wrong than does a more modest model such as IH. Given the relatively lower level of accuracy of GWT, its broader scope is a liability that is not shared by IH. In other words, in terms of simplicity, IH is related to GWT in the same way that a lakeside cabin is related to a mile-high apartment building with a pool on the roof: The cabin is well within proven engineering capacities, while the apartment building is still only on the drawing board. So, as concerns simplicity, IH has a clear and distinct advantage over GWT.
(3) The Sun–Earth Climate Connection. It has been known for centuries that it tends to be warmer when there are lots of sunspots on the Sun. William Herschel (1738–1822) had noticed that the price of wheat in England went up when sunspots were scarce because the weather became cooler and damper. The British astronomer Walter Maunder (1851–1928), who first revealed the 11-year cycle in the numbers (and solar latitudes) of sunspots, also discovered that there was a period of sunspot inactivity from 1645 to 1715, which became known as the Maunder mini- mum. Before the Maunder minimum there was the Spörer minimum (1450–1550),
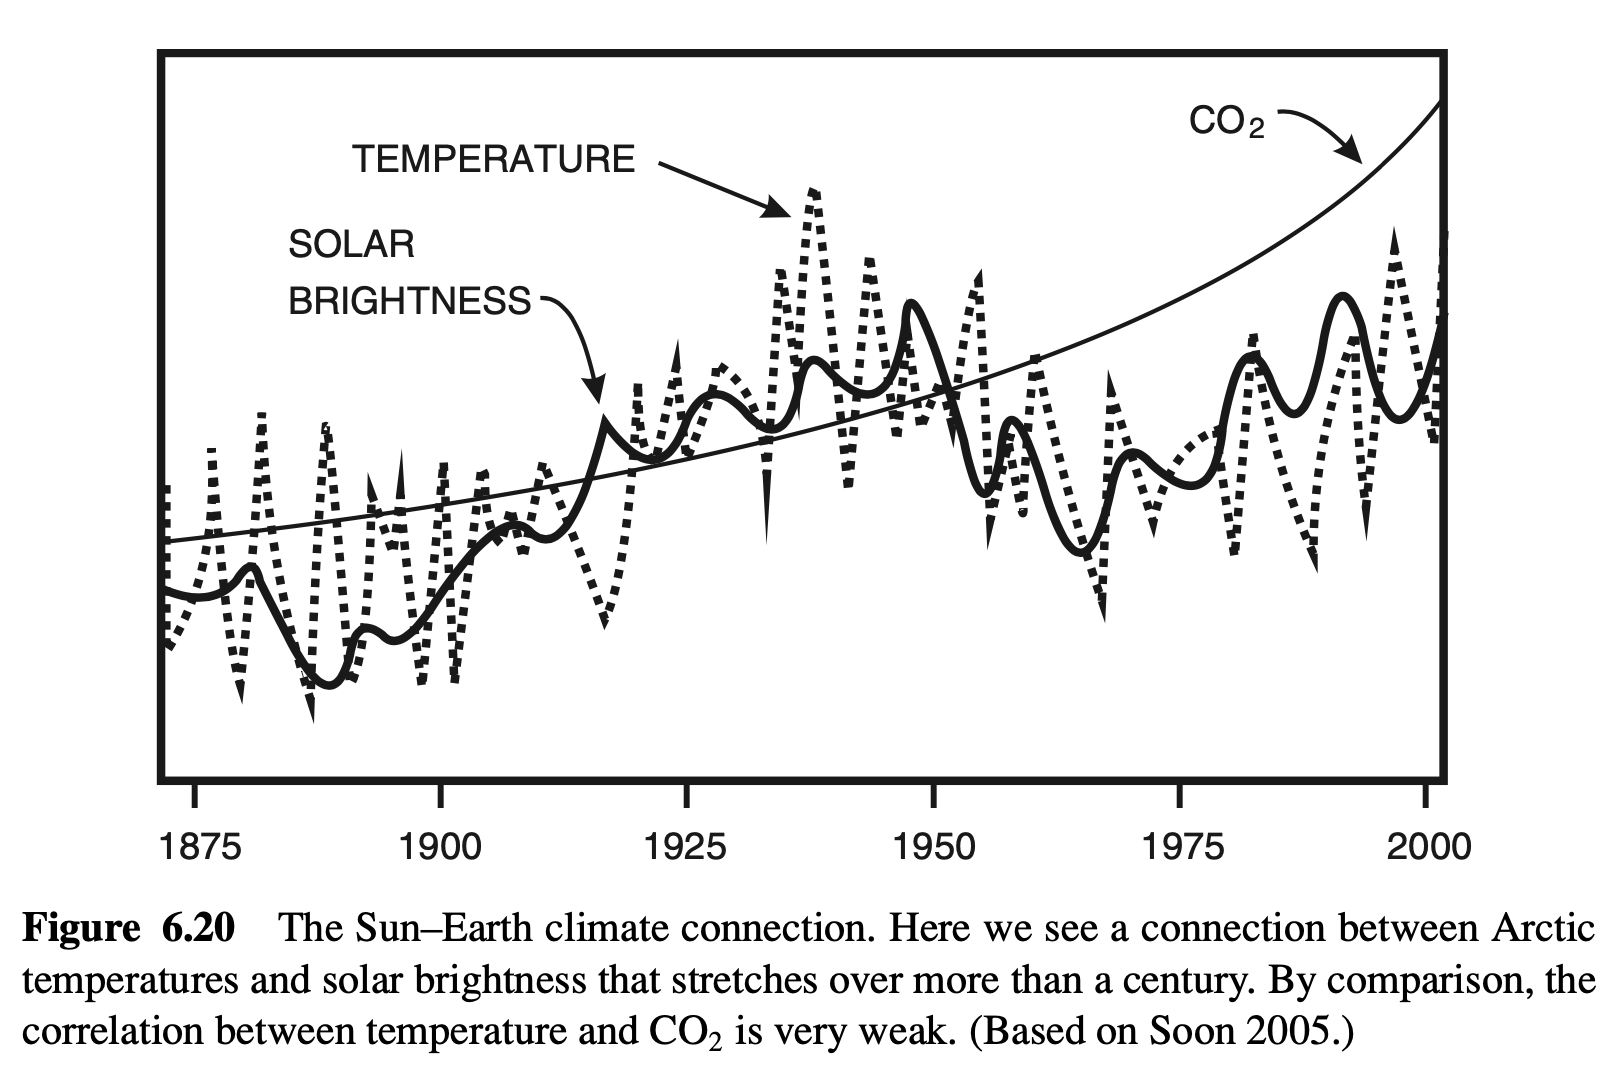
and after it there came the Dalton minimum (1790–1820). These three solar minima spanned the little ice age,69 which brought poverty, famine, and disease to Europe as summers shrank and glaciers grew. Modern research into the solar temperature connection has confirmed that there is a connection: When there are few sunspots, the Sun is relatively inactive, and temperatures fall; conversely, when the Sun is more active and has more sunspots, temperatures rise, as in Figure 6.20 (cf. Friis-Christensen and Lassen 1991). As the graph shows, the Sun–Earth climate connection (SECC) is evident, but a CO₂ climate connection is not.70 Baliunas and Soon (Baliunas and Soon 1995, Soon and Baliunas 2003, Soon 2005) have been trying for many years now to get SECC admitted into the debate on global warming, but have met rigid resistance from GWT scientists and personal attacks by GWT popularizers—in large part because they are solar astrophysicists, not climatologists.
It is quite remarkable, and clearly relevant, that the Sun–Earth climate connection holds for longer periods of time just as it does for shorter ones. If we go way back, 12,000 years ago, to the last ice age, we find that SECC is still in force, as shown in Figure 6.21.71 At all scales, even millions of years ago, there is a close connection between solar activity and temperature (see, e.g., Shaviv and Veizer 2003). This is in
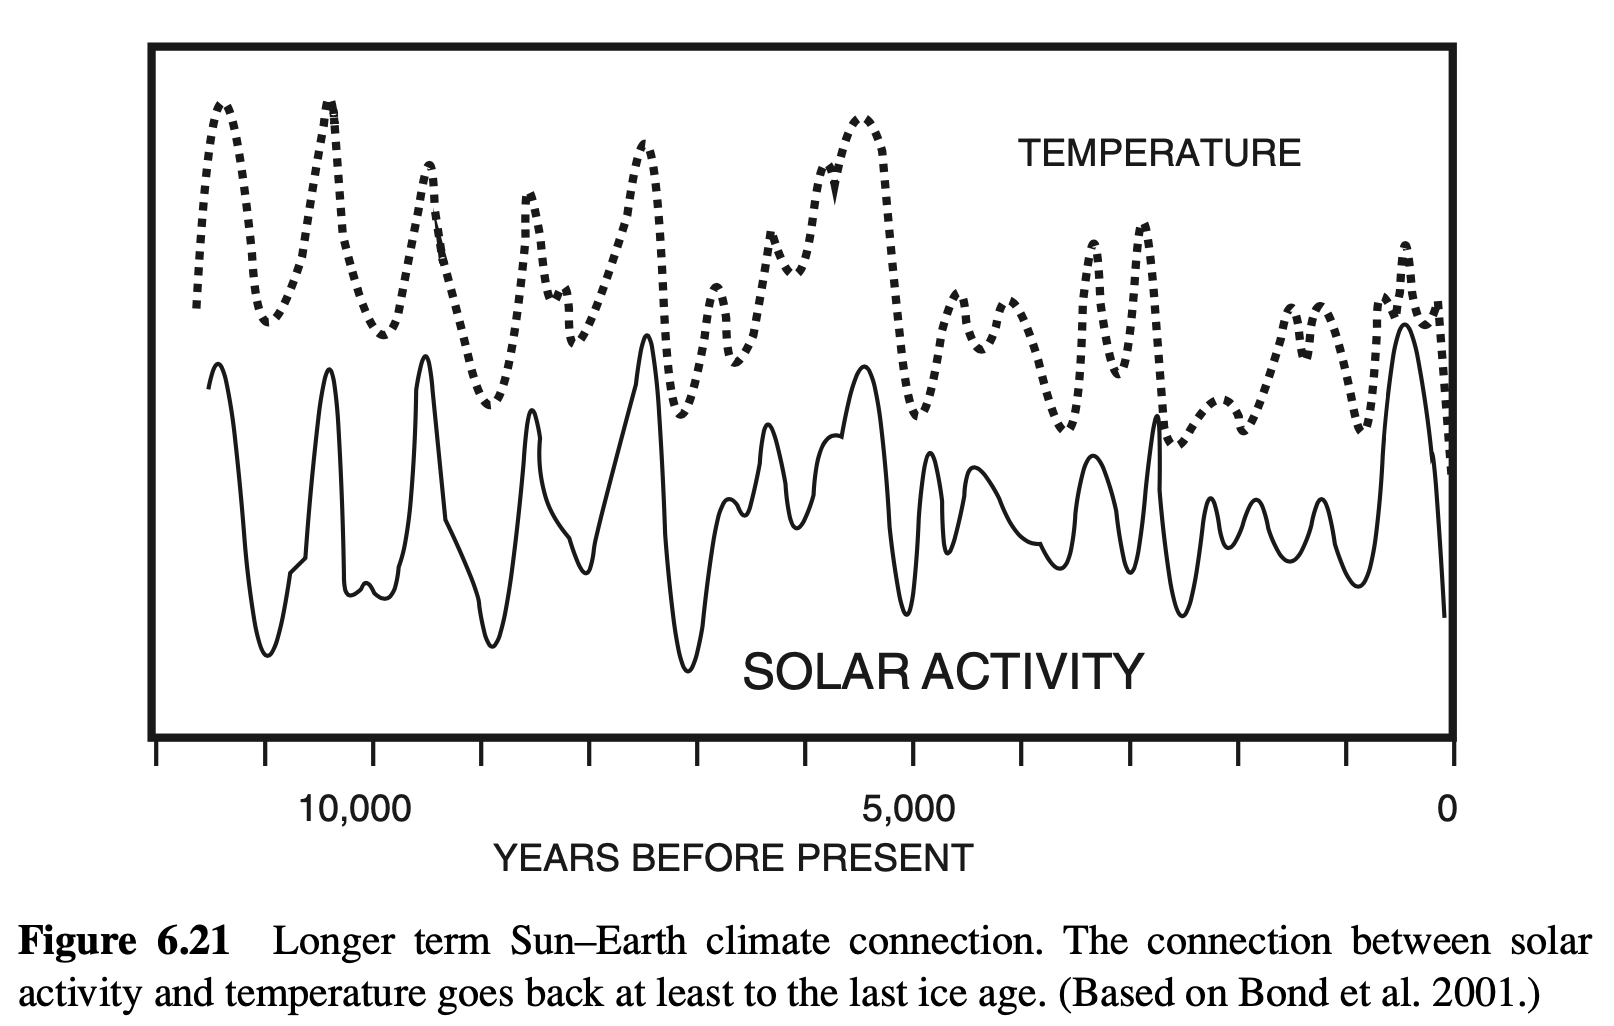
stark contrast with CO₂ which, as we have seen in Figure 6.13, is not correlated with temperature over long periods of time. Those who study this connection tend to come from the ranks of solar physicists rather than climatologists. They speak a different scientific language, so to speak, and are generally dismissed by the IPCC climatologists on the grounds that solar physicists are not climatologists. Surely we should not be trying to settle the epoch-making issue of global warming on the basis of scientific jurisdiction.72 SECC draws attention away from the CO₂ connection that IPCC scientists wish to keep in the public spotlight.73 There is a sorry history, here, of scientific infighting. Part of what makes modern science so strong is constant competition among scientists for recognition and funding. Unfortunately, the spirit of competition can overpower the need for cooperation in getting to the truth. Making matters worse, SECC had an Achilles’ heel: No mechanism had been discovered which could explain, step by step, just how changes in solar activity change temperatures here on Earth. Scientists do not like to accept what they cannot understand. Thus, they have not been inclined to accept SECC as long as its mechanism remained a mystery.
Fortunately, Henrik Svensmark has made significant steps in solving the mystery of the SECC mechanism, despite fighting an uphill battle against the popularity of
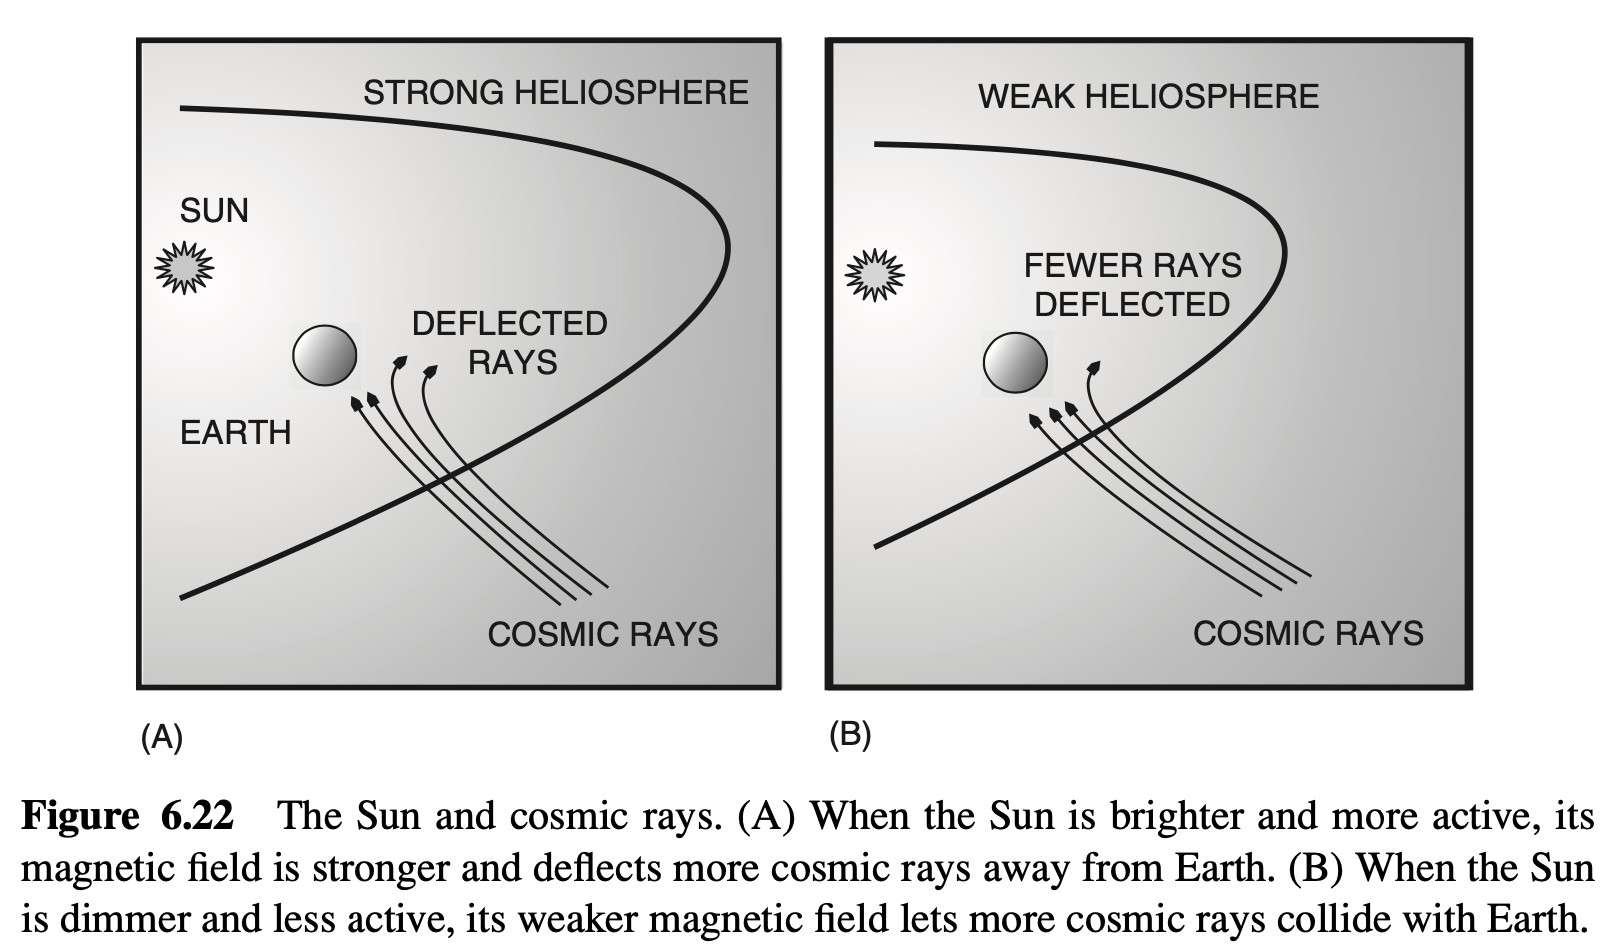
GWT.74 To understand this mechanism, we must first realize that Earth is not in outer space, but in the inner space of the heliosphere: the extended solar atmosphere and magnetic field. Sunspots are marks on the Sun where its massively powerful magnetic field lines pierce through its surface and stream into the inner space in which we dwell. When there are lots of sunspots, the Sun’s magnetic field is strong, as in Figure 6.22A, and this deflects many of the cosmic rays that would collide with our planet when the Sun’s magnetic field is weaker, as in Figure 6.22B. Cosmic rays are particles (mainly helium nuclei) that have energies millions of times more powerful than those achieved in our most powerful accelerators.75 Svensmark got a big break in the mystery of the SECC mechanism when by poring over satellite data he discovered the correlation between cosmic rays and low clouds shown in Figure 6.23.
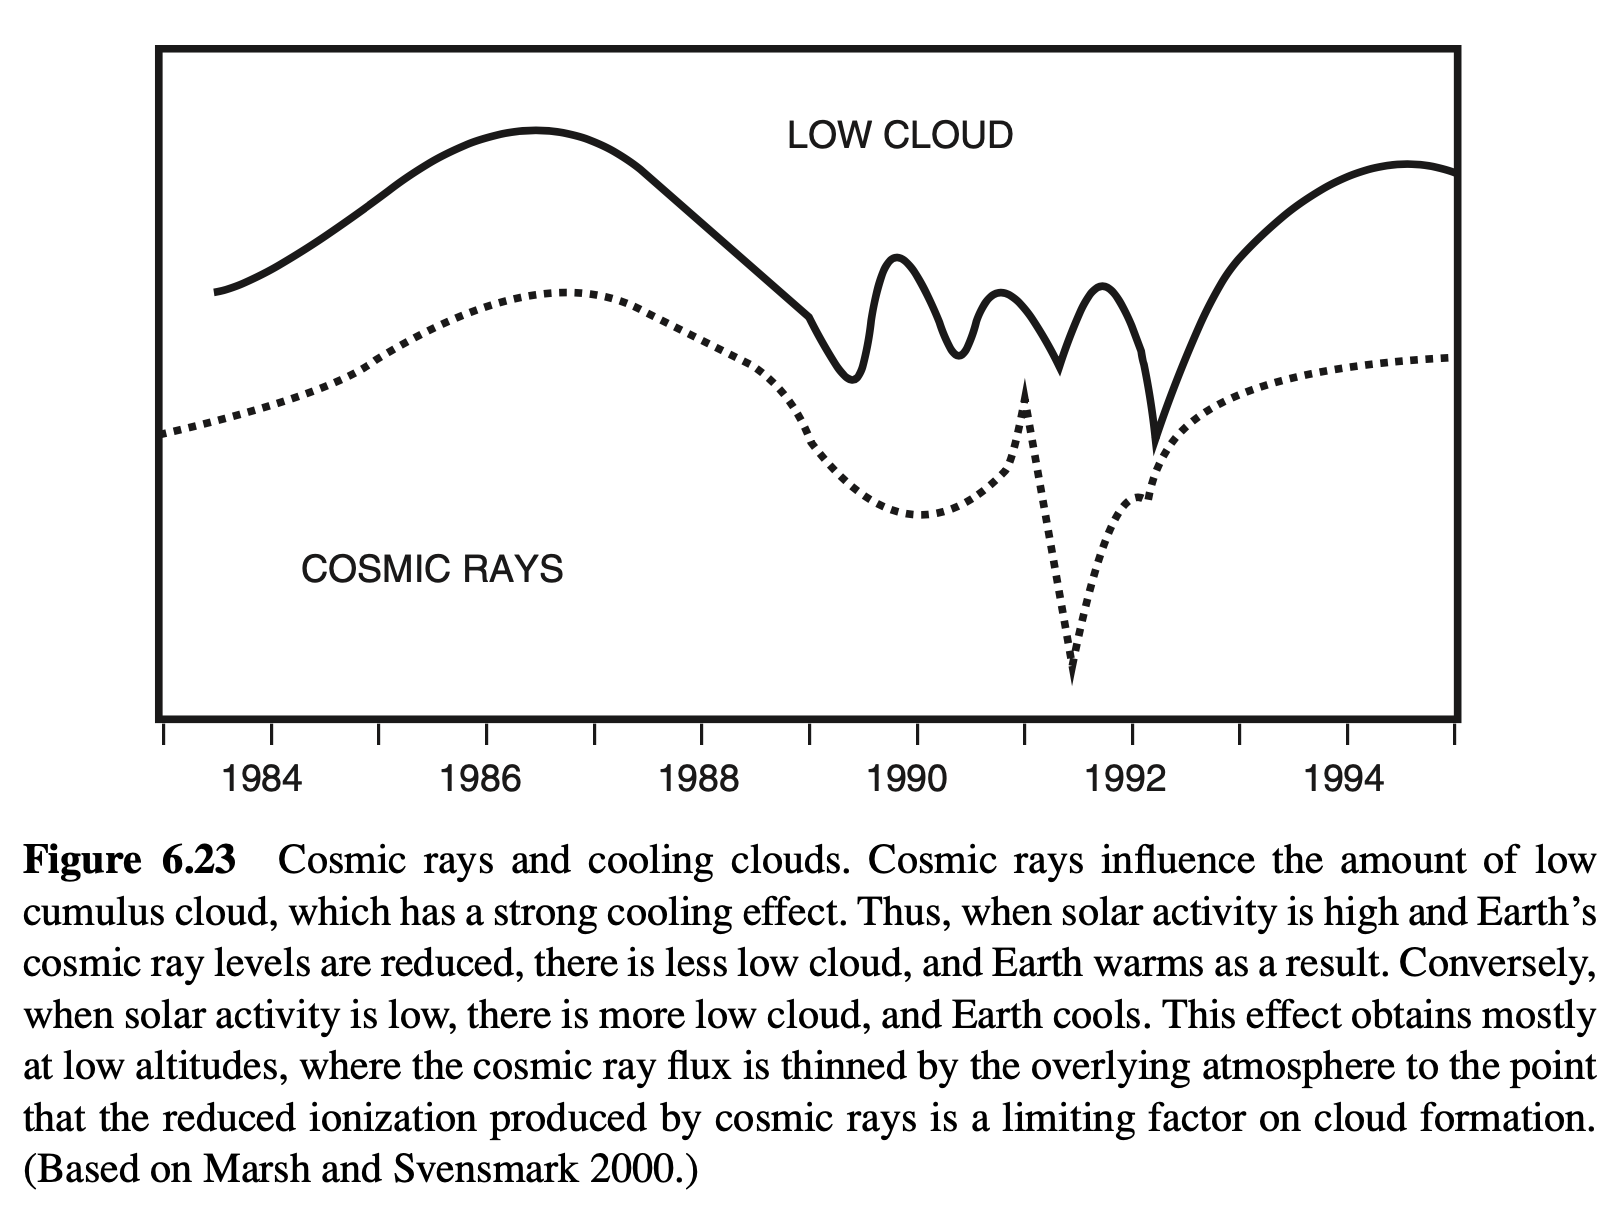
As we saw earlier in this case study, low clouds have a cooling effect: Because they are so bright and white, they reflect lots of incoming solar radiation back into space while reflecting a smaller amount of infrared radiation back to Earth. So when the Sun is inactive, the solar magnetic field weakens, more cosmic rays rain down on Earth, more low clouds form, and Earth is cooled. This crucially relevant result was denied publication for some five years after it was discovered, due to stubborn resistance from IPCC and likeminded scientists (Marsh and Svensmark 2000).76 And once published, these results were still completely rejected by the IPCC because they did not specify a mechanism.77
Svensmark has persisted, and has now traced the steps whereby cosmic rays increase low clouds. Cosmic rays liberate electrons by knocking them off air molecules. These free electrons then cause a cascade of chemical reactions, resulting in the formation of cloud condensation nuclei, the microscopic particles that are required for water vapor to form the tiny droplets that make up clouds.78 Thus, cosmic rays aid the formation of low-altitude cooling clouds. In the upper atmosphere there are always sufficiently high levels of ionization, but at lower levels, where fewer cosmic rays penetrate, the level of ionization is the controlling factor, and thus it is the formation of low-level clouds, cumulus, that is sensitive to the level of cosmic rays. Although Svensmark and his colleagues have faced continuous resistance in getting funding for the necessary research and in getting the results of their research published,79 the first results for the mechanism have now appeared (Svensmark et al., 2007).
Comparative Assessment. Both theories have a very broad scope, because they both apply to global temperatures since the formation of the atmosphere in roughly its present form hundreds of millions of years ago. Both theories are empirically consistent with other scientific theories. When it comes to precision, because the rate of cloud formation depends on many factors, there is not a simple one-to-one relationship between cosmic ray levels and low cloud levels. This makes it difficult to predict precisely how much cloudiness will be caused by a given level of solar activity and cosmic ray flux. So SECC has not, so far, provided precise predictions. As we have seen, GWT, too, does not make precise predictions. Thus, the two models are roughly equal as far as precision is concerned, just as they are for scope and empirical consistency.
When it comes to accuracy, however, SECC has a clear advantage. While solar activity levels and CO₂ levels both track global temperature, SECC does so with much more accuracy, range, and detail, as seen in Figures 6.20 and 6.21. In addition, three sets of data that are barriers for GWT are springboards for SECC. The fact that the rate of surface warming is higher than the rate of tropospheric warming disconfirms GWT (see below), whereas this is just what would be expected with SECC. Since SECC says that global warming starts at the surface when incoming sunlight increases due to reduced levels of cumulus, temperature would rise most at the surface; the extra heat would then escape through the troposphere back into space, producing lower temperature increases at higher altitudes. This, in turn, would solve the radiation budget problem (see No 3), since the extra incoming solar radiation at the surface would cause higher levels of outgoing infrared at the top of the atmosphere. There is even the potential to explain the Antarctic anomaly: since the Antarctic has such high albedo to begin with, it will be relatively unaffected by the albedo effect of cumulus levels.
When it comes to simplicity, SECC again has a clear and distinct advantage over GWT. The mechanism of SECC is much simpler than that of GWT. As we have seen, GWT is an extremely complex theory: Its very definition, not to mention its fate, depends on numerous factors that are poorly understood, poorly measured, and inadequately modeled (water vapor feedbacks, cloud feedbacks, aerosols, parameterization, etc.). SECC, by contrast, concerns only the sensitivity of cumulus clouds levels to cosmic ray levels, which we already understand to be controlled by solar activity levels. SECC proposes that global temperature is controlled primarily by this simple mechanism, with minor variations (noise) added by the chaotic intra- atmospheric processes that GWT hopes to model. Conversely, GWT proposes that global temperature is controlled primarily by the chaotic intra-atmospheric processes, with noise added by the solar processes. So GWT must model the chaotic processes even to achieve a mature and testable status, whereas SECC need only model and test the simpler cumulus formation mechanism.
On balance, SECC seems to be well ahead of GWT. We must note, however, once again, that climate science is still in its early days, and that it is premature to declare winners and losers at this point in time. It is just too soon to tell. However, we may legitimately conclude that SECC has as much claim to scientific respect, attention, and research funding, as does GWT. There is no justification for its ongoing marginalization.
Yes 10: GWT Is the Best Theory Overall. All theories must face some negative evidence, and as you say, all theories must face competing theories. But as you yourself have just admitted, none of the competitors to GWT have anything like its scope and depth of development. There are other theories about this or that climate mechanism, but only GWT is a fully fledged theory of climate. None of the contenders are strong enough to dislodge GWT from its position as the consensus among knowledgeable scientists. So unless and until there is some evidence showing that GWT is clearly mistaken, the wisest choice on scientific grounds alone is to accept it.
No 10: Failure of Troposphere Warming Falsifies GWT. The failure of the troposphere to warm as GWT requires falsifies GWT. If this datum were to be generally understood by the global public, humankind would breathe a collective sigh of relief as it tossed GWT onto the heap of false prophecies that have plagued our history. The IPCC, with the help of massive media attention, has told the global public of the threat of global warming and claimed that recent warming trends prove that the threat is real. Unfortunately, the evidence provided to the public extends only to surface temperature, which are rising in agreement with GWT—assuming that the rise is not caused by the urban heat island effect, or natural variation, and ignoring the fact that temperatures have not risen since 1996. The public has not been informed that tropospheric temperature trends are the opposite of what GWT predicts. Temperatures in the troposphere (the lower layer of the atmosphere, from the surface to 50,000 feet or so80 are rising more slowly than surface temperatures, which is impossible if GWT is right. According to GWT, temperatures must rise more quickly in the troposphere than on the surface. This is another fingerprint of global warming. So the data (if correct) showing that they are not doing so refute GWT. Perhaps the IPCC is afraid that any trace of good news might undermine the public’s resolve to cut back on carbon emissions or else purchase carbon credits to pay the penalty for their misdemeanor.
Sadly, the role of tropospheric temperature in GWT is a bit complex and so is not apt to be swiftly appreciated by the global public. Happily, we can put the basic idea in simpler terms, so that the failure of GWT can be appreciated more broadly. Before we do, however, it is crucial to realize that it is GWT itself that predicts that the troposphere will warm faster than the surface. All of the various models of global warming assume that the middle troposphere warms faster than the surface layer.81 No one, including the proponents of GWT, disputes this point.82 Indeed, the IPCC itself affirms this point since it is nothing other than the central mechanism of GWT (AR4, pp. 265–271).83 In its simplest terms, GWT claims that GHGs in the troposphere will trap heat, and it is this heat trapped above us that will make us warm here at the surface.84 The causal sequence of GWT is very clear and the very essence of the theory itself: Tropospheric warming will cause surface warming. Fortunately for the Earth and all of us living on it, whether plants or animals, the very opposite is happening: surface warming is causing tropospheric warming. We can all breathe a sigh of relief—or we could, if only we were allowed to hear the good news.
The role of tropospheric warming in GWT is most easily understood by means of the simple thermodynamic concept at its core. In considering this concept we do not want to presuppose that it is correct.85 The point, rather, is to see just what it is that GWT is saying. We can begin with the concept of thermodynamic equilibrium, as presented in Figure 6.24. This figure pictures the concept of thermodynamic equilibrium itself. An object in thermodynamic equilibrium, represented by the center box, maintains a constant temperature because the heat flowing into it is precisely balanced by the heat flowing out. In the simplest case, heat flow in and out is reduced to zero: If the object is perfectly insulated, its temperature will not change. However, if some heat leaks out of the object, its temperature can be kept constant by replacing the lost heat, and if some heat leaks into the object, its temperature can be kept steady by removing the heat gained. The heat may flow by conduction, radiation, convection, or whatever other process will transfer heat, and the principle still applies: If heat input matches heat output, the temperature remains constant. Note that heat only flows from things with higher temperature to things of lower temperature, and that the rate of heat flow
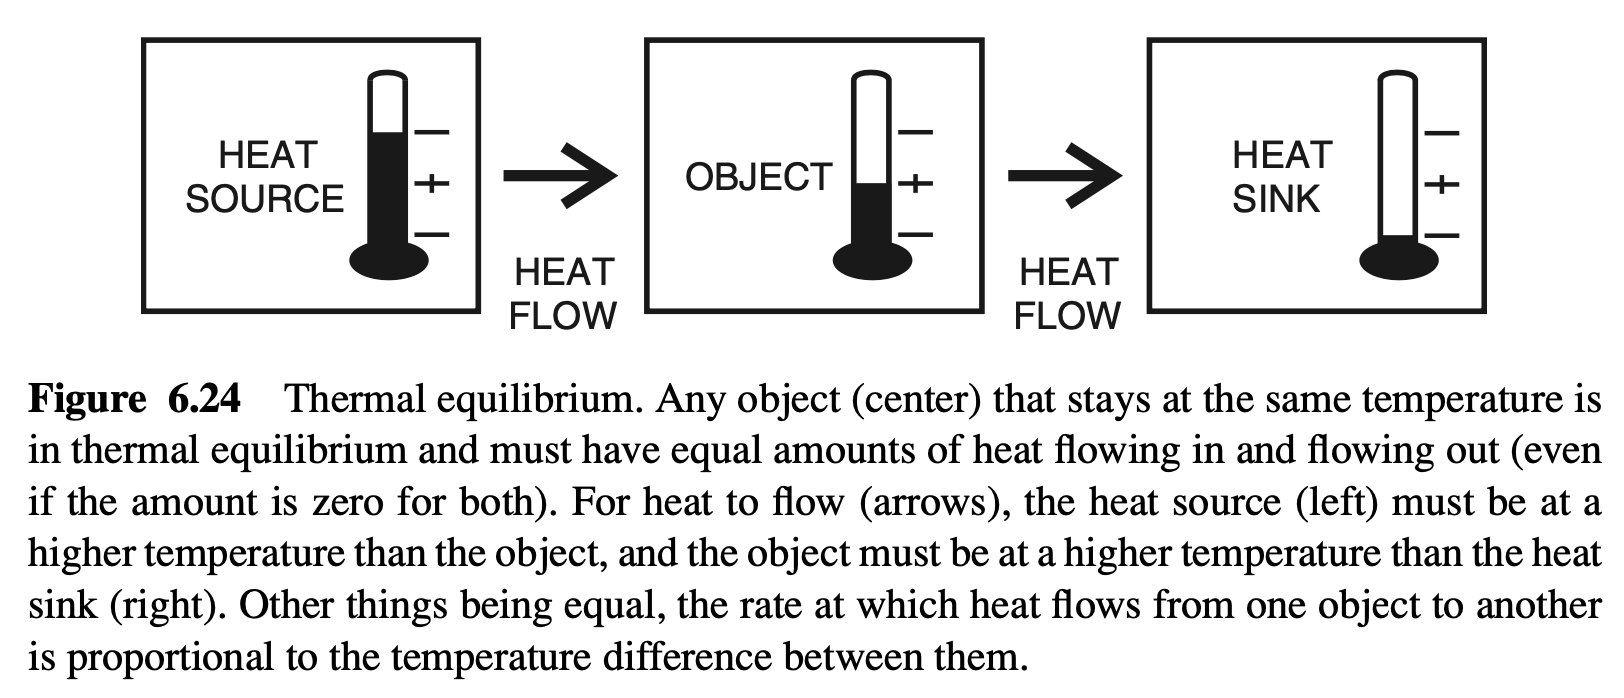
is proportional to the temperature difference between them. For example, an insulator slows the flow of heat by warming up on the side of the warm object and thereby reducing the temperature difference between itself and the object—something we have all experienced when we wrap ourselves up with a blanket on a cold night.86 The object itself could be anything, from a simple rock to the planet as a whole. The thermodynamic principles apply no matter how large or small, simple or complex, the system may be. If we draw an imaginary box around anything at all, this principle applies to whatever is inside.
It follows that there are only two ways that something can warm up: Either the heat input increases or the heat output decreases, as shown in Figure 6.25. GWT uses the second of these two possibilities.87 The important thing for the argument about to follow is that we see that the object in the center of panel B cannot warm up any faster than the object to its right. If it did warm up faster than its heat sink, we would know that it must be getting some extra heat input from somewhere. GWT says that global warming is under way right now88 and that on the planetary scale, Earth is like the center box in panel B, while the troposphere is like the right-hand box.
Moving in a little closer, we can see the mechanism in more detail, as pictured in Figure 6.26. In panel A we have taken a vertical section of the atmosphere and
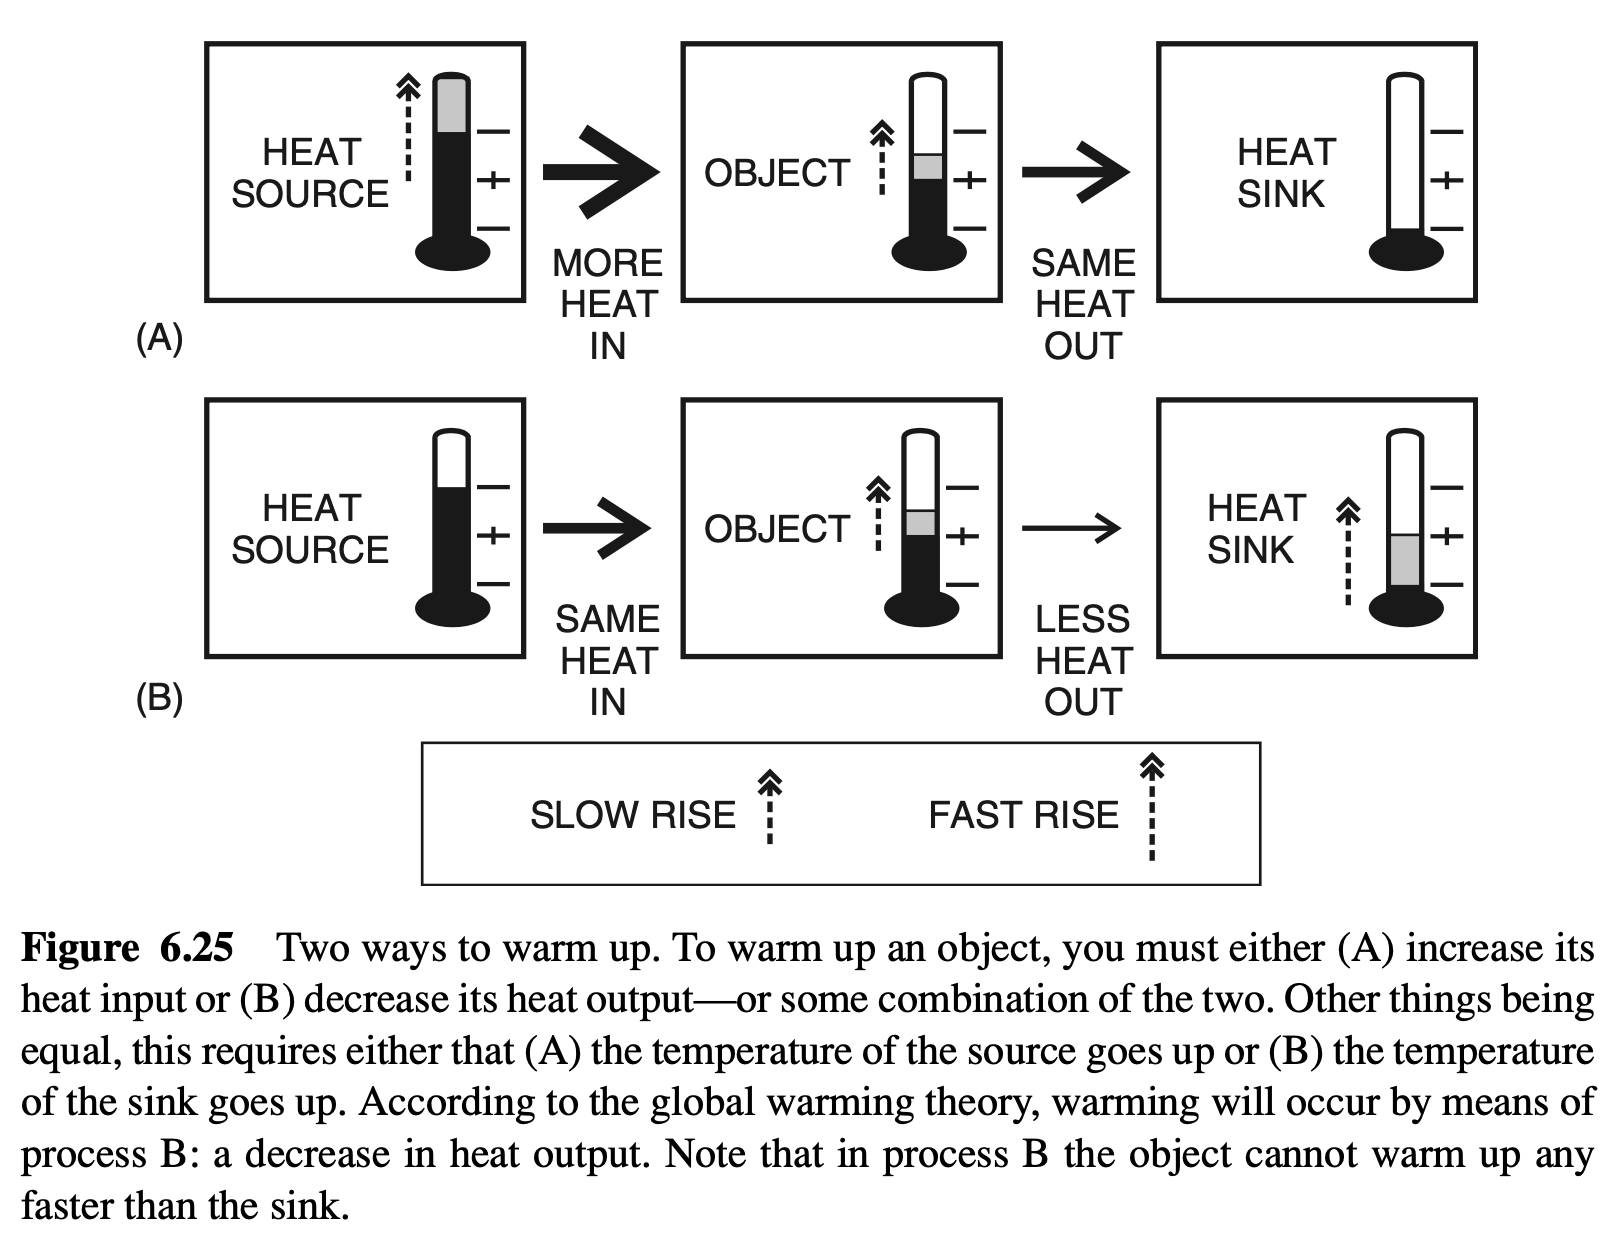
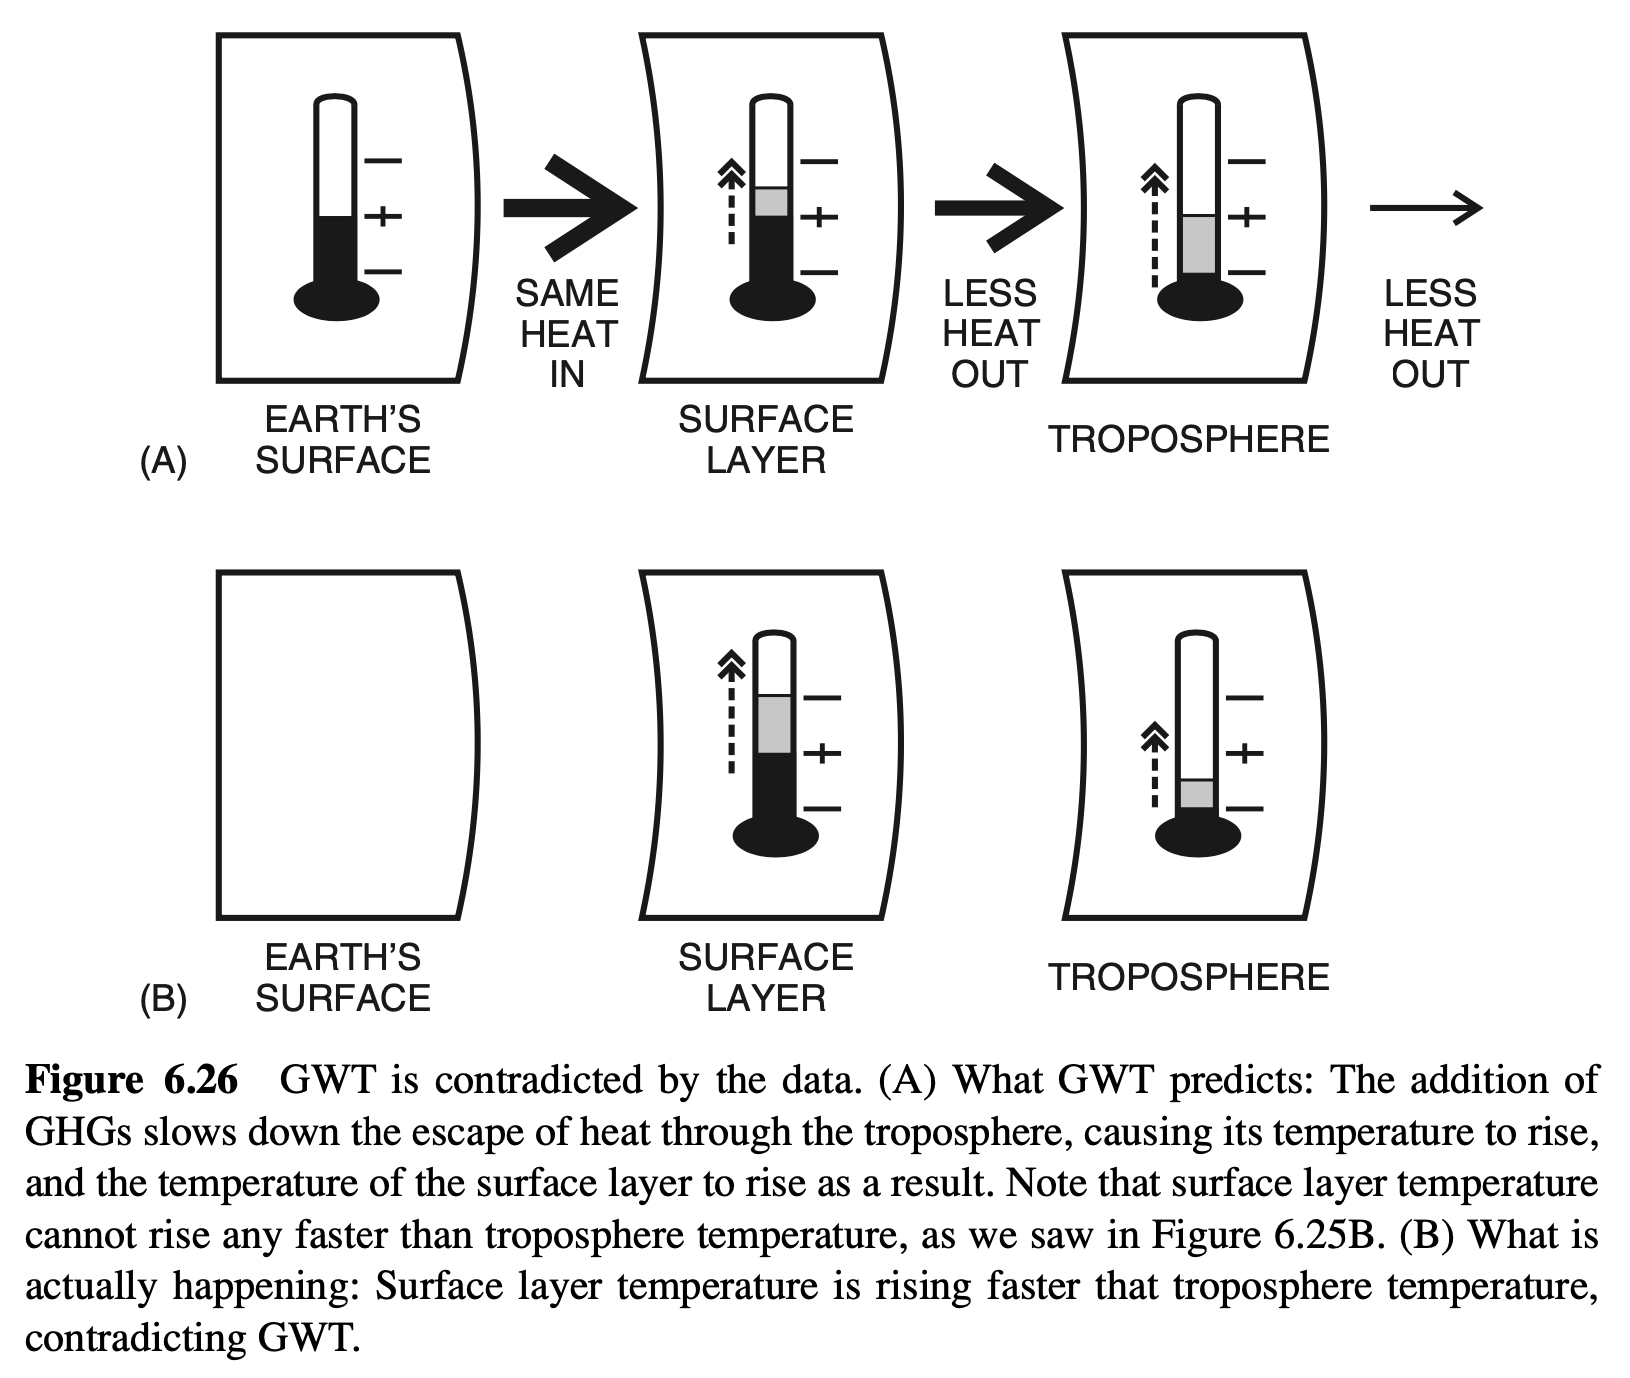
have laid it out sideways to show how the central mechanism of GWT is supposed to work. On the left we have the surface of the Earth. This includes every point at which the atmosphere touches the ground, oceans, ice caps, forests, fields, rooftops, or city parking lots, for these are the points at which light from the Sun is converted into infrared and radiated back up into the atmosphere. Most atmospheric heat starts at the surface, as we have noted earlier. In the center we have the surface layer, the layer a few meters above the ground. It has no precise depth, but it is at center stage, since it is where we live—and not just us, but all of the birds and bees and grass and trees as well. The warming that is referred to by the phrase global warming or climate change (in IPCC 2007c the second phrase is preferred) is the warming of the surface layer.
On the right we have the troposphere, which is the mechanism of the warming. The troposphere is the glass in the greenhouse metaphor that is supposed to be trapping heat in the surface layer below. The rising levels of GHGs, in particular CO₂, slow down the transport of heat through the troposphere. Because of increasing GHGs, infrared radiation from the surface layer is more likely to be absorbed by a GHG molecule than before. These molecules soon re-radiate their heat as infrared once again, and it is reradiated equally in all directions, warming the troposphere. Thus, heat escapes more slowly from the surface layer,89 warming us up and giving us higher temperature readings in our weather reports.90
The problem for GWT, as we see in panel B of Figure 6.26, is that just the opposite is happening.91 If the warming predicted by GWT had been happening, the troposphere would have been warming faster than the surface. But the data indicate just the opposite: The surface has been warming faster than the troposphere. The National Academy of Science describes the situation as follows: “Although warming at Earth’s surface has been quite pronounced during the past few decades, satellite measurements beginning in 1979 indicate relatively little warming of air temperature in the troposphere” (NAS 2001, p. 17). That summarizes the raw data, but the important issue is the relationship between the rates of change on the surface and in the troposphere: “The committee concurs with the findings of a recent National Research Council report [NRC 2000], which concluded that the observed difference between surface and tropospheric temperature trends during the past 20 years is probably real . . .92” (ibid., my emphasis). Thus it is the fact that surface temperatures are rising so much faster than tropospheric temperatures that poses the problem for GWT. Indeed, the NAS summarizes the problem in stark terms: “The finding that surface and troposphere temperature trends have been as different as observed over intervals as long as a decade or two is difficult to reconcile with our current understanding of the processes that control the vertical distribution of temperature in the atmosphere” (ibid.). Once again, we see that climate science is still full of surprises.
The document then goes on to discuss possible sources of surface heat, possible mechanisms of heat storage in the oceans and elsewhere, possible errors of measurement, and possible fundamental errors in modeling. In short, GWT did not explain surface warming. So it is not a simple matter of GWT models having failed to accommodate a phenomenon we are now observing, which would be bad enough. Instead, it is a matter of a failure of the central concept upon which these models are based.
This really should put an end to the prophesied threat of GWT.
Yes 11: Newer Data Have Resolved the Tropospheric Warming Problem. The U.S. Climate Change Science Program (with the blessings of the IPCC) has quite responsibly encouraged a full scientific investigation of the problem you outline, and the results have exonerated GWT (USCCSP 2006). This investigation found errors in the data upon which your objection is based, and by correcting them has shown that measured tropospheric temperatures fall within the ranges of our newest climate models (ibid.; see Figs. 3 and 4, pp. 12 and 13, for a summary of these results). The USCCSP results have been included in the latest IPCC assessment report (AR4), in which it is concluded that GWT has been proven sound. So the tropospheric warming problem has been resolved, and we must begin the process of eliminating CO₂ emissions, which, although painful, is the least painful path for both the environment and humankind in the long run.
No 11: Tropospheric Data Do Not Resolve the Tropospheric Warming Problem. As the recent history of climate science has shown us, climate data itself can be full of surprises. The USCCSP’s “intensive efforts to create new satellite and weather balloon data sets” (ibid., p. vii) to resolve the discrepancy between GWT and the data has borne fruit: The “significant discrepancy no longer exists because errors in the satellite and radiosonde data have been identified and corrected” (ibid., p. 1). The data itself has given way, and thus GWT has been saved from sudden death. However, the USCCSP report does not claim to exonerate GWT, only to save it from outright falsification. All it claims is that the estimated error ranges of the reinterpreted data do partially overlap the error ranges of new models of global warming (Ibid., see Figs. 3, and 4, pp. 12 and 13), at least when averaged globally.
The mechanics of warming at any particular place on the globe still remains a problem, however. In particular, the mechanics described by GWT fail for the all important tropics. If GWT does not work for the tropics,93 it does not work, period. The USCCSP clearly states that the failure of tropospheric warming still applies for the tropics. “Comparing trend differences between the surface and the troposphere exposes potentially important discrepancies between model results and observations in the tropics. In the tropics most observational data sets show more warming at the surface than in the troposphere, while almost all model simulations have larger warming aloft than at the surface” (Ibid., p. 10). In other words, Figure 6.26 still applies in the all-important tropics: GWT models call for warming caused by decreased heat outflow, while the data still indicate an increase in heat inflow at the surface. So GWT does not work for the tropics—so it does not work, period.
Yes 12: Troposphere Warming Has Been Observed, So GWT Is Proven. As the previous argument itself presupposes, the absence of troposphere warming, which had been such a matter of concern for the NAS and NRC, has proven to be a matter of data errors. We should be reassured by the fact that the scientific community has behaved in such a responsible fashion by holding up GWT to the highest standards, and chastened by the fact that their investigations have shown it to be quite real.
No 12: The Relative Rates of Troposphere and Surface Warming Still Falsify GWT. It is the relative rates of warming that matter, not the absolute amounts. As the USCCSP report itself states unequivocally in the passage quoted above, GWT models require that the troposphere warm faster than the surface, but the data show that it is warming slower than the surface.94 So GWT is disconfirmed decisively by these crucial data.
Yes 13: Even If the Rates Are Wrong, GWT Is Still Broadly Consistent with the Data. The latest IPCC report explicitly takes the results of the USCCSP investigation into account,95 and it says, quite accurately: “It appears that the satellite tropospheric temperature record is broadly consistent with surface temperature trends” (AR4, p. 237). As long as GWT is consistent with the data, it should be accepted.
No 13: Even If We Ignore the Inadequate Rate of Troposphere Warming, GWT Is Reduced to Insignificance by the Data.96 An interesting fact lies hidden in the data summary of the USCCSP and adopted by the IPCC.97 In the latest GWT models, the surface warms up at about two-thirds as fast as the troposphere.98 Since we know how fast the troposphere has been warming, we can calculate the amount of surface warming that can be attributed to global warming itself, and it turns out to be only one-third of what GWT calls for.99 So even if GWT is right, the actual warming that has occurred because of rising GHGs is insignificant (a mere 0.6º by 2100), less than one-third of the warming predicted by GWT. 100 If we take the figures of a study better designed as concerns the relationship between surface warming and troposphere warming (Lee et al. 2008), surface warming is between one-third and one-half of troposphere warming, which gives an even lower figure of 0.3 to 0.45º by 2100. If we add in the lack of warming in surface temperatures since 1996, this number will be reduced by another third or so. Sea-level rise and other “catastrophic” predictions must be scaled back accordingly. Life on this planet, including human life, has handled similar climate changes in most of the centuries of its history. So even if GWT is right, the actual warming that has occurred because of rising GHGs is insignificant—a nuisance, not a catastrophe.
By the way, the argument above does not in any way imply that GWT has been shown partially correct by the USCCSP report. Indeed, the data reported, even after corrections, is still in stark disagreement with what GWT requires, as shown above. But if we are to get into “even if” arguments, then even if some of the warming between 1975 and 1995 was the result of added GHGs, this effect has been insignificant. There is no reason to reduce and eliminate CO₂ emissions. The apocalyptic prophecy is false, and we do not have to sacrifice our economy.101

- That what we now call science was originally called natural philosophy is an interesting and still relevant fact, but one that we cannot go into here. Suffice it to say that philosophy is the pursuit of wisdom, not knowledge, and wisdom involves knowledge, including knowledge of nature, as well an understanding of the significance of the thing known to the knower and what stance the knower should take toward it. Since Newton’s day there has been a further specialization: Scientists seek only knowledge of nature, not wisdom. Environmental philosophy is, as I understand it, the return of philosophy to nature after abandoning it to the scientists: natural philosophy reborn. I encourage anyone who thinks this is a good idea to get involved. ↩
- An axiom, or postulate, is a claim that is assumed true although no proof of its truth is offered. All chains of proof must stop somewhere, and axioms are those stopping places. Axioms are often said to be self-evident or intuitively obvious. A typical axiom is this one, taken from geometry: Given any two distinct points on a line there exists at least one other point between them. A moment’s reflection shows that you cannot even imagine how this could be false. The beauty of mathematics is that it shows how subtle and complex mathematical propositions which are not obviously true can be proven by being derived logically from axioms that are obviously true. Newton believed that all natural science was provable in this way. ↩
- Newton himself did not think that universal gravitation was axiomatic, so he did not include it among his three laws. However, he did not realize that those three laws themselves are not axiomatic either: They are not self-evidently true, but rest instead upon observation. ↩
- The use of “Mach 1” to indicate the speed of sound, “Mach 2” twice the speed of sound, and so on, derives from his name: the study of shock waves, using the then cutting-edge technology of photography, was one of his scientific specialties. ↩
- There are two significant and illuminating exceptions here. Within cognitive science, many scientists (the psycho-functionalists, as philosophers call them) have the view that cognition is nothing other than computation of some sort, and so believe that computation of the right sort, even in a computer rather than a brain, actually is cognition. Within artificial life research, some scientists believe that a properly constructed program not only models life (or evolution), but in some sense is really alive (or really evolving). ↩
- For example, Einstein knew that his theory of relativity had the same empirical content as Newton’s theory in the vast majority of cases already tested by observation, where velocities were small relative to that of light, and knew, moreover, that this was essential in order that his theory have any chance of being right. ↩
- Some, like Sandra Harding (1991), have called for the explicit embrace of “liberatory” goals for science, opining that if science is subject to nonlogical influences anyway, those influences should at least promote social justice, particularly for women. Environmentalists might just as well have proclaimed that science should embrace environmental goals—as, indeed, they have in fact done within environmental science. Others, like James Brown (1994), have called for broadening the scientific community itself to include members of underprivileged groups, arguing that if science is open to prejudice anyway, a full palette of representative prejudices is better than those of the group that actually happens to gain entry into the scientific community [for my reply, see Foss 1996b]. Many environmentalists do encourage or demand consultation with indigenous experts as part of understanding a given ecosystem, and many practicing environmental scientists do consult with them in their fieldwork. Some, like Paul Feyerabend (2001), were pleased by the prospect that science will become pluralistic, and that what he perceives as its monopoly on the human imagination will be relaxed. Others, like the European postmodernists Foucault (1926–1984) and Derrida (1930–2004), have taken the dimmer view that science is just another instrument of institutionalized power within the grim scenario of “modernity.” ↩
- Ruddiman also proposes that the worldwide plagues around the middle of the last millennium resulted in the so-called little ice age, a period of cooling over most of the last half of the millennium, as human populations reduced and so, consequently, did the amount of agricultural production of greenhouse gases. It has also been noted that sunspots were absent during the onset of the little ice age, a phenomenon called the Maunder minimum. It is also known that solar output reduces with the number of sunspots. Furthermore, it is known that fewer sunspots indicates a weakened solar magnetic field, which results in an increase in the cosmic radiation striking the Earth, that may in turn cause increased cumulus cloud cover and hence global cooling. Since human agriculture did not cause a reduction in solar activity, it would seem that reduction of solar activity is a strong rival cause of the little ice age. This is just one possible failure of Ruddiman’s theory. We will take up the issue of greenhouse warming in Case Study 7. ↩
- It is worth noting that the goal need not be achieved for it to exist. The function of the sperm is to fertilize the egg, although only a tiny fraction of actual sperm (there are hundreds of millions in a single human ejaculation) ever achieve that goal, thank goodness. Similarly, a defective kidney still has the function of cleansing the blood even if it is unable to perform that function. The fact that the goal need not be realized to exist marks it as “intentional” (a technical, theory-laden piece of philosophical terminology), which we may gloss as a state “intended” by the system, whether or not it is actualized. This is characteristic of values in general: They are defined by intentional goals. ↩
- For a much more extensive, but accessible, introduction to deterministic chaos, see Gleick (1987). For more accessible details from the point of view of mechanical systems, see Foss (1992). ↩
- Aristotle used meteorology as an example of an imprecise science and identified the cause of its imprecision as chance. His favorite example of chance is meeting a friend unexpectedly. Although nothing that either oneself or one’s friend does escapes natural law, the chance meeting cannot be predicted. ↩
- By 2030 the case will, hopefully, be settled, although we must not discount people’s tendency to cling to what they want to believe even in the teeth of the evidence. From a logical point of view, however, whether we renounce fossil fuels or not we will see whether global warming theory (GWT) is right by 2030, because according to GWT there will be obvious warming either way. GWT’s proponent, the IPCC, lays it all on the line (IPCC 2007a, hereafter AR4, Assessment Report 4, p. 89): “Near term warming scenarios are little affected by different scenario assumptions or different model sensitivities. . . . The multi-model mean warming, averaged over 2011 to 2030 . . . lies in a narrow range of 0.64º C to 0.69º C. . . .” Although it is not mentioned by the IPCC, by its own figures, global temperatures stopped rising in 1997 (AR4; see, e.g., Fig. TS.7, graph D, p. 38). If this sideward trend continues, or if temperatures go down, GWT will be effectively falsified. If, on the other hand, the temperature rises by approximately the amount predicted during the next two decades, global warming will be confirmed. No doubt some GWT proponents will not accept falsification if global temperatures do not rise as predicted. Already some have suggested that widespread, if not global, cooling may be a temporary effect of global warming, due to disruption of heat flows via ocean currents. We should be very wary of any theory that is supposed to be verified by any possible turn of events. This sort of unfalsifiability is precisely the mark of an nonscientific hypothesis, as Karl Popper has so plainly shown us. ↩
- The models used in this section of AR4 assume a doubling of CO₂ by 2100 and then an abrupt halt of CO₂ emissions. They predict temperature rises of 1 to 4ºC, which fall only a fraction of a degree by the year 3000. ↩
- Scientific forecasts of the impact of global warming, should it be real, include a rich mixture of both positive and negative effects for both humankind and the environment, resulting in something like a rough balance overall—or even a net gain. The IPCC’s own study (IPCC 2007b) notes that there will be a global increase in precipitation, which will have a beneficial effect on many ecosystems. The reason is simple: Vegetation is the nutritional basis of all life on Earth, and vegetation prospers in warm, hence moist, eras, and suffers in cool, hence dry, eras, as shown in Figure 4.1 (Section 4.1). There is no doubt that the warming trend from the early 1980s to the late 1990s had this positive effect (see, e.g., Nemani 2003). ↩
- The Kyoto Accords agree only on the 2010 and 2050 targets, although the IPCC premises its afore- mentioned catastrophic prediction of thousands of years of warming on a complete elimination of CO₂ emissions by 2100. Presumably, then, the IPCC would advise that CO₂ emissions be eliminated by 2100 in order that the catastrophe not become even bigger than it has forecast. ↩
- Some have argued very persuasively that the Kyoto Accords would have little effect (e.g., Wagley, 1998, 2005), a conclusion not denied by IPCC. ↩
- The vents are very small relative to the glass surface of the greenhouse, usually 10% or less, and given the usual design of a greenhouse, provide little chance for escape for infrared light which, unlike air, must travel in straight lines to get outside. ↩
- According to NASA (2007a) satellite data, the transparency of a cloudless atmosphere to incoming sunlight is 78% (with 16% absorption and 6% reflection). ↩
- The opacity of the atmosphere to outgoing infrared is 91%: of the 70% of incoming radiation that makes it through clouds and reflective barriers to be absorbed by Earth’s surface (6% is reflected by the atmosphere, 20% is reflected by clouds, and 4% is reflected by the surface), only 6% (8.6% of the total) is radiated directly into space, while the remaining 64% (91.4% of the total) is carried by the atmosphere and its water vapor (NASA 2007a). ↩
- The IPCC currently identifies three main tiers of models. Starting from the bottom they are simple climate models (SCMs); above that there are Earth system models of intermediate complexity (EMICs), and at the apex AOGCMs, which used to stand for atmospheric ocean general circulation models, but which now also include other factors, and so are defined as follows: “They include dynamical components describing atmospheric, oceanic and land surface processes, as well as sea ice and other components” (AR4, p. 67). ↩
- In the words of the IPCC, “although the large-scale dynamics of these models are comprehensive, parameterizations are still used to represent unresolved physical processes such as the formation of clouds and precipitation, ocean mixing due to wave processes and the formation of water masses, etc. Uncertainty in parameterizations is the primary reason why climate predictions differ between different AOGCMs” (AR4, p. 67). ↩
- The IPCC calculates that CO₂ has increased from 280 ppm in 1750 to 379 ppm in 2005, causing a warming effect of 1.66 (±0.17) watts per square meter, which in turn has caused a global temperature rise of about 1ºC (AR4, p. 25). The National Academy of Sciences arrives at a significantly smaller figure, 1.4 W/m² (NAS 2001, p. 12). ↩
- I have had the benefit of speaking with a number of scientists who support GWT (including my University of Victoria colleague Andrew Weaver, a prominent climate modeler and author of IPCC scientific documents) and have found that when push comes to shove, they fall back on the NV+HF intuition. When I query them about the complex vagaries and uncertainties of climate feedback mechanisms, I often meet the following sort of reply: “Look, if you add CO₂ to an aquarium, it’s going to get warmer. Adding CO₂ to the atmosphere is going to have the same effect. Sure, there are all sorts of feedbacks, but the effect of CO₂ is to change the radiative balance in favor of warming. It’s as simple as that.” So they say. ↩
- See, for example, AR4, pp. 61–63: in particular, Figs. TS.22 and TS.23. ↩
- The decrease in radiation being reflected back into space is less than 2 W/m², and the increase in the heat escaping Earth is more than 5 W/m², for a net increase in outgoing radiation of more than 3 W/m². ↩
- The graphs on which this figure is based clearly showed the unpredictable wigglyness (see Section 2.1) that characterizes so many natural phenomena. This wigglyness was suppressed for these figures to make the overall trends more evident. All data graphs in this chapter have been smoothed to make trends more evident unless stated otherwise. ↩
- We might speculate that the increase in surface temperatures and the increase in outflowing radiation of 3 W/m² may have been due to a release of stored heat from the oceans. This would explain why ocean heat content has been decreasing (ibid., Fig. TS.16, p. 48), which in turn might explain why temperatures have not been rising over the last decade (AR4, e.g., Fig. 3.17 p. 268): Cooler oceans are absorbing atmospheric heat. ↩
- McIntyre and McItrick (2003, p. 752) report that the graph “appears in Figures 2-20 and 2-21 in Chapter 2 of the Working Group 1 Assessment Report, Figure 1b in the Working Group 1 Summary for Policymakers, Figure 5 in the Technical Summary, and Figures 2-3 and 9-1B in the Synthesis Report.” They go on to point out that the information graphed is used as a basis for an alarming claim: “Referring to this figure, the IPCC Summary for Policy Makers (p. 3) claimed that it is likely ‘that the 1990s has been the warmest decade and 1998 the warmest year of the millennium’ for the Northern Hemisphere.” This alarming claim was then used to advance the political acceptance of GWT: “The IPCC view of temperature history has in turn been widely disseminated by governments and used to support major policy decisions.” ↩
- See, e.g., Lamb (1988, pp. 115–161), Keigwin (1996), and Fagan (2000) for an account of the science and the human toll of the little ice age as it brought the prosperity of the medieval warm period to an end. ↩
- The Committee on Energy and Commerce and the Subcommittee on Oversight and Investigations. ↩
- “However, the substantial uncertainties currently present in the quantitative assessment of large-scale surface temperature changes prior to about a.d. 1600 lower our confidence in this conclusion compared to the high level of confidence we place in the little ice age cooling and twentieth-century warming. Even less confidence can be placed in the original conclusions by Mann et al. (1999) that ‘the 1990s are likely the warmest decade, and 1998 the warmest year, in at least a millennium’ because the uncertainties inherent in temperature reconstructions for individual years and decades are larger than those for longer time periods, and because not all of the available proxies record temperature information on such short timescales. We also question some of the statistical choices made in the original papers by Dr. Mann and his colleagues” (North 2006, p. 5). North did, however, assert repeatedly that global warming is real. ↩
- The passage continues as follows: “. . . and has tended to dismiss their results as being developed by biased amateurs. The paleoclimatology community seems to be tightly coupled as indicated by our social network analysis, [and] has rallied around the MBH98/99 [Mann et al. 1998, 1999] position” (ibid, p. 49). The tight coupling referred to essentially comes down to the fact that within the “community” of researchers studied (which by no means included all paleoclimatological researchers, but only a small subset of them) published results were supported by reference to yet other published results from within the same subset. ↩
- The good sense of this recommendation is obvious. It was not followed for reasons outlined in the rise of environmental science described in previous chapters, and still is not followed. Nor is there any indication that it will be followed. Although the policy consequences of the IPCC program are of unprecedented enormity, there are virtually no safeguards in place to help prevent errors of the sort involved in the hockey stick graph episode. Far more stringent requirements for accuracy and disclosure of data sources are required for simple business deals than for the most momentous policy decision the world has ever faced. The authors of AR4, the most recent IPCC document, still cite their own scientific work in support of their position. ↩
- During the medieval warm period there were vineyards in London, and during the little ice age the Thames would freeze over during the winter. These well-known historical facts are downplayed by the IPCC as merely local warming, although they lasted for several centuries [see, e.g., Lamb (1988, pp. 115–161) Keigwin (1996), Fagan (2000), Esper et al. (2002), and Moberg et al. (2005)]. ↩
- The warmest period since the last ice age was about 6000 years ago, when forests reached their farthest northern extent (their fossilized remains can still be seen). At that time the monsoons were stronger than they are now and extended into the Sahara desert itself. At the southern edge of the desert, Lake Chad grew as it was fed by these monsoons during these warmer temperatures. As temperatures fell the lake began to shrink and has been shrinking ever since. Al Gore (2006) claims that the lake is shrinking because of global warming. Climate history indicates that cooling, not warming, reduces this lake. See Lamb (1988, pp. 21–22) for a brief history of these changes. ↩
- Actually, the graph shows the level of a temperature proxy, a substance that tracks temperature, since there were no thermometers in place thousands of years ago. In this case, the proxy is deuterium taken from deep ice cores. CO₂ is also measured from the same ice cores, to compare its level with that of the temperature proxy. It is assumed that the levels of both substances in the snow that fell those many thousands of years has not changed from then until now, a view that is open to challenge (see, e.g., Jaworski et al. 1992). As noted previously, some of the detail of the graph upon which this one is based has been suppressed to make trends more apparent. ↩
- For example, Fischer et al. (1999), Petit et al. (1999), Indermu ̈ hle et al. (2000), Yokoyama (2000), Monnin et al. (2001), Mundelsee (2001), Clark et al. (2002), Caillon et al. (2003), and Stott et al. (2007). ↩
- In this case, changes in levels of an isotope of argon (40Ar) are taken as a temperature proxy. Actually, there is a disagreement in the dating of this event between the sources on which this graph and the previous one are based. I have left this disagreement as is, rather than trying to resolve it. Interesting as this disagreement may be, such disagreements between scientific sources are not unusual. In any case, this disagreement is not central to the point at issue, since is concerns the absolute dating of the ice cores rather than disagreement about the order of events: The two sources agree that CO₂ changes followed temperature changes. ↩
- This is not to say that the inference is necessarily valid. If B follows A, then either (1) A causes B, or (2) both are caused by something else, C, but have no direct causal linkage, or else (3) there is no causal connection at all and their temporal sequence is mere coincidence. However, if B tracks A over long periods of time, mere coincidence is usually taken to be implausible, and a causal connection of form (1) or (2) is assumed. Given that there is a well-known mechanism whereby temperature rise would cause a rise in CO₂, it is now generally suggested that the causal linkage is of form (1) rather than form (2): that temperature change causes CO₂ change. The mechanism is the warming of oceans and soil moisture, which reduces the amount of CO₂ that they can hold in solution. ↩
- This page of AR4 consists of Box 6.2, which searches for an explanation of the rise and fall of CO₂ levels in response to temperature changes. After exploring various possibilities, some of which are inconsistent with the others, the search is declared a failure: “In conclusion, the explanation of glacial–interglacial CO₂ variations remains a difficult attribution problem….The future challenge is not only to explain the amplitude of glacial–interglacial CO₂ variations, but the complex temporal evolution of atmospheric CO₂ and climate consistently” (AR4, p. 446). ↩
- The inference is explained this way: “Because the climate changes at the beginning and end of ice ages take several thousand years, most of these changes are affected by a positive CO₂ feedback; that is, a small initial cooling due to the Milankovitch cycles is subsequently amplified as the CO₂ concentration falls.” This hypothesis is accepted because without it climate models fail to work: “Model simulations of ice age climate (see discussion in Section 6.4.1) yield realistic results only if the role of CO₂ is accounted for” (AR4, p. 449). ↩
- Some readers may notice the positive feedback loop: The rise in temperature due to the positive feedback of water vapor should cause a further increase in water vapor, hence an even bigger rise in temperature, and so on. Would this not yield runaway heating? No, not necessarily. Suppose that the CO₂ rise in temperature is y degrees and that this rise in temperature increases water vapor by a certain amount, which in turn raises temperature by 0.8y degrees. This last temperature rise will lead to more water vapor, and yet more warming, by the amount (0.8 × 0.8)y degrees, and so on—ad infinitum. Note, however, that this does not cause runaway warming, since the arithmetical series, y + 0.8y + (0.8 × 0.8)y + (0.8 × 0.8 × 0.8)y + · · · converges, to yield 4.0y. Whereas a feedback factor (or gain) of 0.8 is fine, a parameter of 1.0 (or greater) would be disastrous, leading to infinite heating: y + 1.0y + (1 × 1)y + (1 × 1 × 1)y + ··· does not converge. So the outcome of any GCM is extremely sensitive to the setting of this parameter. Large changes in the warming predicted by a model can be brought about by small changes in this parameter. ↩
- GCM stands for general circulation model, which is a misnomer inasmuch as GCMs do not model atmo- spheric circulation (wind, storms, or “weather” in the commonsense meaning of the term), but instead, model radiation balance and represent the effects of circulation on that balance by parameterization. AOGCM stands for atmosphere–ocean GCM (see AR4, pp. 981, 982). ↩
- Eighteen models are cited in support of the main conclusion that CO₂ will cause dangerous warming by the end of the century (AR4, p. 71). ↩
- “The cloud feedback mean is 0.69 W/m² with a very large inter-model spread of ±0.38 W/m²” (AR4, p. 630). We return to this issue below. ↩
- See Chen et al. 2002 and Wielicki et al. 2002. It appears that there was a reduction in high cloud over the tropical oceans which permitted heat to escape from the top of the atmosphere. Generally speaking, this reduction in high cloud is not well understood, although it is in agreement with Lindzen’s iris hypothesis discussed below. ↩
- The NRC states the problem (2003, p. 31) as follows: “Cloud feedbacks are currently diagnosed primarily by using coarse resolution climate models and even simpler one-dimensional equilibrium models.” The data points used by GWT models are on the order of 100 kilometers apart, which is much larger than real convection cells, and have a vertical resolution of perhaps three to six vertical layers, which is much too coarse to capture the relevant dynamical details of convection, and hence of advec- tion. In short, GWT models cannot actually model convection or advection—in a word, weather. For this reason they must reduce this ineliminable aspect of the hypothesized warming to simple functions, or parameters. ↩
- Although the authors of this NRC document go on to prescribe research strategies to resolve PP, they also note deep scientific and research-community problems that will be very difficult to overcome. Until they are overcome, GWT remains in limbo, due to the gap between it and observational data. PP is a component of many of the GWT problems outlined below. ↩
- In the “Technical Summary” written for nonscientists and policymakers, the water vapor effect is estimated by IPCC to be “approximately 1 W/m² per degree global temperature increase, corresponding to about a 50% amplification of global mean warming” (AR4, p. 65). This is a bit misleading, inasmuch as all by itself water vapor would “at least double the response” to greenhouse gases (p. 632; also NRC 2003, p. 22). But the IPCC reduces this 100% minimum amplification by subtracting one negative feedback, the lapse rate effect, and ignoring other feedbacks, both positive and negative, to get its 50% amplification figure. The reason given for this is that the “close link between these processes [water vapor radiative feedback and the lapse rate effect] means that water vapor and lapse rate feedbacks are commonly considered together” (AR4, p. 632). True enough, but this does have the effect, especially in a technical summary intended for nonscientists, of exaggerating the effect of CO₂ and other anthropogenic GHGs relative to water vapor—and keeping them in the spotlight. But how water vapor reacts to GHGs may be more important than the GHGs themselves. One researcher, for example, argues that “a 12% reduction in the magnitude of the lapse rate completely nullifies the water vapor feedback” (Sinha 1995, p. 5095). Data show, and IPCC claims, a decreased lapse rate. Clearly, the ultimate effect of anthropogenic GHGs will depend very sensitively on just how, and how much, they affect the lapse rate. ↩
- As we noted earlier, IPCC models indicate that the effect of CO₂ alone would be about 1.2ºC, while the full effect given all of the positive feedbacks would be about 3.2ºC, or nearly three times as large (AR4, pp. 630–631). But as has often been pointed out, the IPCC may underestimate the influence of water vapor, and thereby underestimate the uncertainties in GWT. Harries, for example, reports: “But as has often been pointed out, this IPCC claim may underestimate the influence of water vapor, and thereby underestimate the uncertainties in GWT.” For example, Harries says that “. . . uncertainties of only a few percent in knowledge in the humidity distribution in the atmosphere could produce changes of the outgoing spectrum of similar magnitude to that caused by doubling carbon dioxide in the atmosphere” (Harries 1997). ↩
- As reported by the NRC (2003, p. 22). As seen in the preceeding note, water vapor levels affect the lapse rate, which once again leads to uncertainty about the final effect of water vapor. Sinha estimates that “increasing the lapse rate magnitude by 6%. . . amplifies the modeled water vapor feedback by 40%; conversely, a 12% reduction in the magnitude of the lapse rate completely nullifies the water vapor feedback” (Sinha 1995, p. 5095). ↩
- The cloud feedback mean of IPCC MFMs is “0.69 W/m² with a very large inter-model spread of ±0.38 W/m²” (AR4, p. 630). ↩
- The work of R. J. Charlson (e.g., Charlson et al. 1992, Charlson and Wagley 1994) on sulfate aerosols went unnoticed for decades until he pointed out the possibility of explaining cooling spells in terms of sulfates. Once this message reached climate modelers, they promptly produced models which included this effect, and Charlson’s work gained sudden recognition. ↩
- Their direct effect is estimated to be −0.5 [−0.9 to −0.1] W/m² (AR4, p. 29) and their cloud albedo effect is estimated to be −0.7 [−1.8 to −0.3] W/m² (AR4, p. 30), for a total effect of −1.2 [ −2.7 to 2 −0.4] W/m². ↩
- The total estimated GHG effect is 1.6 (+0.6 to +2.4) W/m² (AR4, Fig. TS.5, p. 32). ↩
- If this is not already amazing enough, we might note that it is possible that the cooling effect of aerosols may be only one-third of the −1.2 W/m² accepted, with low certainty, by the IPPC. If the real figure is only -0.4 W/m², which is inside the error range, then global warming would be overestimated by 1.2 W/m². This would reduce global warming to 0.4 W/m², which is hardly anything to get excited about, since it would have only a slight effect on temperature—of about 0.25ºC. This would also, by the way, be a result that lies outside the IPCC high-confidence error bar—which may indicate some internal tension, if not outright inconsistency, among its error ranges. ↩
- Specific humidity varies from about 2.2 g/kg in the Arctic (Gerding et al. 2004) to about 14 g/kg in the tropics (Newell et al. 1974), while total column water vapor varies from about 3 mm in the Arctic (Kiedron et al. 2001) to about 60 mm in the tropics (Mather and Ackerman 1998). ↩
- These are (1) different times of daily temperature observation at different weather stations, (2) correction of traditional maximum and minimum temperatures, (3) correction for “station history,” which includes anything from change of instrument, instrument location, instrument housing, to change of location of station, (4) filling in of missing data by interpolation, and (5) the UHI adjustment (J. Hansen et al. 2001). ↩
- This correction is larger than that used by the U.S Historical Climate Network (J. Hansen et al. 2001, e.g., Plate 2). Hansen, one of the scientists who prepares the GISS estimates, says on the GISS website that “the urban warming that we estimate (and remove) is larger than that used by the other groups (as discussed in the 2001 Hansen et al. reference above [J.Hansen et al. 2001])” (J.Hansen 2007). This shows both that the UHI correction is a matter of debate if not disagreement, and that the correction used by the “other groups” is very small indeed. Also interesting in this context is the fact that GISS has recently admitted that its U.S. temperature records over the last decade or so were 0.15ºC too high, due to an error concerning a much simpler matter than UHI corrections. ↩
- There are eight duplications within and between these two books, so that a total of 77 individual scientists are involved. ↩
- My thanks to Richard Lindzen of MIT for suggesting that I include the null hypothesis as a competitor to GWT. ↩
- Suggestions in the general direction of this mechanism had been made before by Ramanathan and Collins (1991, 1992). ↩
- In “No Evidence for Iris,” Hartmann and Michelsen (2002, hereafter HM) attacked the methods of LCH. They focused on LCH’s use of cloud-weighted SSTs, their central argument being that the reduction in cirrus is due to “latitude and longitude shifts” coupled to “meteorological forcing” which, they speculated, “seems to originate in the extratropics and is probably unrelated to tropical SSTs” (HM, p. 249). There are well-known differences in meteorological activity tied to differences in latitude in the region studied by LCH: There is more convective upwelling near the equator and more downward flows of this air returning to the surface at higher latitudes (the Hadley circulation), and then converging once again in the zone of upwelling. The resulting intertropical convergence zone has some longitudinal features (e.g., it is broader in the west Pacific, or monsoon basin, than it is in the Atlantic) but is mainly a function of latitude. HM’s suggestion amounts to the idea that the reduction in cirrus insulation that LCH observe is tied to these meteorological patterns rather than to the underlying SSTs as such. Both are effects of a common cause—one is not the effect of the other. In other words, “the observational evidence uses a gradient with latitude as an analogy for climate change, which it probably is not” (NRC 2003, p. 34; the NRC authors cite HM’s “No Evidence for Iris” at this point; Hartmann chaired the panel that authored this work). LCH (2002) responded that if HM was right, “we would expect a noticeable reduction of the effect when the poleward limit of the region considered was reduced. . . . Rather, the opposite is observed” (ibid., p. 1346). When this region (the southwest Pacific between Australia and China) is reduced from a 30º swath each side of the equator to a 25º swath, the thinning of cirrus insulation over areas of higher SSTs is even more apparent than before. The map they provide of SSTs for the region (ibid., Fig. 3, p. 1347) may explain why: There is a greater span of SSTs along the east–west axis than along the north–south axis. So if there really is a connection between cirrus reduction and SSTs, reducing the north–south extent of the region considered would therefore reveal the connection more strongly, which the evidence indeed indicates. ↩
- Lin et al. (2002) argued on the basis of their models that a small warming effect should result, and Chou et al. (2002) replied, admitting a possible 20% reduction in the cooling effect, but no more. ↩
- Rapp et al. (2005) accumulated data to test the suggested mechanism of increased precipitation efficiency, and did indeed find a 5% decrease in the ratio of cloud area to rainfall over areas of higher SST (ibid., p. 4192). More rain was produced by the same amount of cloud as SSTs increased, just as the proposed mechanism for the iris required. Moreover, these data did not depend on the use of cloud-weighted SSTs, which were the focus of criticism by HM. Nevertheless, Rapp et al. did not see these data as confirming IH, since the increased precipitation efficiency did not occur high in convection towers but in low clouds. However, their methods did not rule out the possibility that the higher precipitation rate for low clouds included the lower level of convective towers, which would have been consistent with IH. Indeed, this result also agrees with other studies showing greater precipitation efficiency over higher SSTs, including a study LCH cites in support of IH and in which he also participated (Sun and Lindzen 1993, Lau and Wu 2003). So presumably greater precipitation frequency in low clouds is seen by LCH as consistent with IH. If it is, the work of Rapp et al. is actually in favor of IH after all. ↩
- Wielicki also expected that the rise in escaping infrared must involve cloud changes, in particular decreasing cirrus, as required by IH. Unfortunately, when he analyzed his data, he could not find this effect. ↩
- Spencer et al. report “The sum of SW [shortwave] CRF [cloud radiative forcing] (≈ −SWall) and LW [long wave] CRF (= − [LWall − LWcirc]) plotted against the tropospheric temperature anomalies for the middle 41 days of the fifteen ISO composite (Figure 4) reveals a strongly negative relationship. A linear regression yields a sensitivity factor (slope) of − 6.1 Wm−2 K−1, with an explained variance of 85.0%” (ibid., para 20). By comparison, the effect of CO₂ levels rising by 100 ppm since 1750 is estimated to have an effect of 1.66 W/m². Note, however, that the CO₂ effect is global, whereas the iris effect has been observed only above the oceans between 30ºS and 30ºN latitude. This is, however, the area of highest solar heating efficiency (since the Sun strikes other areas more obliquely), and the effect may apply to oceans in general, not just the tropics. ↩
- AR4 (p. 65) specifies climate sensitivity as ranging between roughly 1 and 6ºC, whereas a narrower range is given for the IH feedback factor of roughly −0.8 to −1.1 per ºC rise in SST. So GWT is aiming at a wider target than IH and so is to that extent more likely to hit it. On the other hand, any strong negative feedback due to the IH mechanism will be taken as confirmation, so the difference between them on this score is more apparent than real. ↩
- There is no firm agreement on the dating of the little ice age. It began somewhere between 1300 and 1600, and ended around 1850. ↩
- For an emphatic, indeed passinate, marshalling of the evidence, see Jaworski (2003) and Robinson et al. (2002). ↩
- Periods of high solar activity are marked by lower levels of cosmogenic isotopes left behind in the environment. These isotopes are caused by cosmic rays colliding with Earth’s atmosphere and surface; the levels of cosmic ray flux go up when solar activity, and hence the solar magnetic field, are low. By measuring the levels of these isotopes left behind in tree rings, soil, and their fossilized remains, we can determine solar activity levels in the distant past, before humans kept records, and compare these with temperatures. ↩
- But if it does come down to jurisdiction, Earth’s climate is obviously not a closed system. Factors from outside Earth’s atmosphere, such things as comet or meteorite impacts, can and do affect our climate. The behavior of the Sun cannot therefore be ignored. The fact that the IPCC already takes variations of solar brightness into account concedes this point. The relevance of the Sun cannot simply be decreed to stop with brightness, but must be discovered by diligent observation. The SECC shown in the last two figures are precisely such observations. ↩
- “The Danish delegation to the Intergovernmental Panel on Climate Change [IPCC] made a modest proposal in 1992, that the influence of the Sun on the climate should be added to a list of topics deserving further research. The proposal was rejected out of hand” (Svensmark and Calder 2007, p. 73). ↩
- In the words of the eminent solar scientist who discovered the solar wind, Eugene Parker (whose own work was often rejected because it defied scientific orthodoxy), “Svenmark received harsher treatment [than I did] for his scientific creativity, and found it hard to achieve a secure position with adequate funding” (Svensmark and Calder, 2007, p. viii). Such treatment is, sadly, often the lot of those scientists who break with scientific orthodoxy, even though this is a necessary condition of scientific innovation: “He is in good company, when we recall that Jack Eddy lost his job when he confirmed and extended the earlier work of Walter Maunder, who had pointed out that the sun showed a significant dearth of sunspots over the extended period 1645–1715” (ibid.). Confirming an extended absence of sunspots may seem a virtuous (or at least harmless) thing to do—unless, of course, it challenges the presuppositions of an established field. Climatologists have by-and-large presupposed that solar variations have no significant effect on climate, but “Eddy emphasised the important point that the Maunder Minimum was a period of cold terrestrial climate, thereby making the first direct connection of climate to solar magnetic activity” (ibid.). Given the work of Eddy and that of Parker himself, we may be dismayed that SECC continues to receive short shrift from the GWT orthodoxy. But let us not lose hope that justice will prevail: in 2003 Parker was awarded the $400,000 Kyoto Prize for Lifetime Achievement in Basic Science. Perhaps the importance of SECC will be recognized. Perhaps then some fraction of a percent of the billions of dollars of climate research funding may be directed to working out the physics of SECC, given that all parties agree it is crucially important to accurately predict future climate. ↩
- Whereas human particle accelerators achieve energies around 1013 eV (electron volts), cosmic rays can have energies of 1020 eV. ↩
- When Svensmark and his colleague Eigil Friis-Christensen reported their results at a meeting of the British Royal Astronomical Society in 1996, the Chair of the IPCC, Bert Bol ́ın, said to the media: “I find the move from this pair scientifically extremely na ̈ıve and irresponsible” (Svensmark and Calder 2007, pp. 73–74). They tried to publish the results in Science, but “queries came back. When those were dealt with by brief additions, the verdict was the paper had become too long” (ibid., p.71). ↩
- The tension between theory and observation has a long, vexed history. From the time of Empedocles (492–432 b.c.e.) through to the time of modern medicine, doctors were identified as either empiricists (“empirics”) or dogmatists (also known as “rationalists”). Empiricists would prescribe medicines and treatments on the basis that they were known by experience to work, even though there was no acceptable theory of their action in terms of the four humors: black bile, blood, yellow bile, and phlegm (which were the biological forms of the four elements Earth, air, fire, and water, respectively). In retrospect, empiricism is the clear winner: Observation trumps theory. You were better off taking a folk remedy for your illness that was known to be effective by observation than being bled to reduce the amount of air in your body. Dogmatic biologists insisted that men had more teeth than women (because they were stronger, etc.) rather than looking to see. When Galileo showed that a light lead weight falls as fast as a heavy one, he was suspected of trickery or witchcraft, since reason “proved” that heavy bodies fall faster. Modern scientists claim to be empiricists, but dogmatism still has a stronger influence in some cases (e.g., the rejection of meteorites by the French Academy). The case of the SECC seems to be one of these: Rather than being excited by this important discovery and encouraging its investigation and development, a dour orthodoxy among some climate scientists has hindered, and is hindering, its mere recognition. ↩
- The electrons attach themselves to oxygen molecules. These electrically charged oxygen molecules, or ions, attract a number of water vapor molecules, which, given the usual background levels of ozone, react to form ozone ions. The ozone ions are attached to water molecules, and in the presence of background levels of sulfur dioxide, react to form sulfite ions. The sulfite ions then react with water vapor to form ionized molecules of sulfuric acid, which are cloud condensation nuclei. These condensation nuclei attract more water molecules and so form the larger droplets of water of which clouds are made. ↩
- Various accounts of this resistance, sometimes directly by IPCC officers, as well as the intercession of concerned scientists on his behalf, are now circulating on the Internet (e.g., http://www-tc.pbs.org/ moyers/moyersonamerica/green/isanewsletter.pdf; http://www.canada.com/nationalpost/story.html?id=fee9a01f-3627-4b01-9222-bf60aa332f1f&k=0), but perhaps the best account is Svenmark’s own (Svensmark and Calder 2007, esp. pp. 99–131). ↩
- The layers of our atmosphere are defined in terms of pressure, and thereby ultimately in terms of the mass of the atmosphere in each sphere. Thus, the troposphere is defined as the layer of the atmosphere which has a pressure of at least 100 millibar. Since the sea-level surface pressure is usually very close to 1000 millibar, the troposphere is the bottom 90% of the atmosphere by mass. At lower pressures (below 100 millibar) and hence higher altitude lies the stratosphere. ↩
- GWT models, as well as various calculations, show that the maximum warming should occur at an altitude of about 6 miles (10,000 m). ↩
- For example, Gaffen et al. (2000), NAS (2001, pp. 15–17), Lindzen and Giannitsis (2002), Lanzante et al. (2003), Santer et al. (2003). ↩
- Although AR4 never comes right out and states that tropospheric warming must be greater than surface warming, this is presupposed by the discussion in the sections cited below, which are dedicated to arguing that despite numerous scientific data and publications showing that surface temperatures are rising more quickly than tropospheric temperatures, “reanalyses” (pp. 269–270) of these data “largely resolves a discrepancy noted in the TAR [Third Assessment Report, (IPCC 2001a])” (p. 36; my italics). While not mentioning statements by such august scientific bodies as the National Academy of Science and the National Research Council, the IPCC argues that “the satellite tropospheric temperature record is broadly consistent with surface temperature trends,” as claimed earlier (p. 36). This argument is tendentious in at least two ways: (1) It discounts some data sets, plays up others, and uses the GWT-preferred rangers of its own error estimates; and (2) it downplays the absence of tropospheric warming as a minor matter, assuming that “largely” avoiding outright falsification, and “broadly” attaining consistency with fundamental thermodynamics is good enough for the purposes at hand. Nothing could be further from the truth. Merely dodging sudden death hardly shows GWT to be a good basis for redesigning the human economy. If the IPCC held the welfare of humankind uppermost, it would welcome the possibility of such wonderful news as that GWT may be wrong. Instead, the IPCC (2007) buries the issue in a technical discussion that attacks the data and blurs the problem. This evidences a tendency of the IPCC to take its advocacy of GWT more seriously than it takes pursuit of the truth. As any good scientific team will do, the scientific team of the IPCC is busy building and developing a complex scientific theory, and so almost by definition professes and promotes the theory it is building. But usually, this promotion occurs solely within the scientific community, in full expectation of a critical response. However, the advocacy approach of the IPCC toward GWT is unbalanced when it comes to the establishment of policy, which is most unfortunate given the enormous significance that any scientific error concerning GWT may have for human welfare. It may be that IPCC’s Global Warming Program is seen as good for the environment, even if it is not good for humankind, and this may soften critical scrutiny of GWT by the IPCC. If that is true, it would mean that the IPCC scientific team is not engaged in value-neutral science but in advocacy environmental science as defined in Chapter 5. ↩
- A concise statement of this aspect of GWT can be found in the definition of the atmospheric greenhouse effect provided by the website for the Central Equatorial Pacific Experiment (CEPEX): “The atmosphere, primarily water vapor and CO₂, absorbs most (70 to 95%) of the surface long-wave radiation and re-emits [it] to space at the much colder temperature of the atmosphere. The effect is to reduce OLR [out- going longwave radiation, or infrared]” (http://www-c4.ucsd.edu/cepex/index.html, 10 October, 2007; my italics). This is a description of greenhouse warming in general, the natural phenomenon that we are supposed to be enhancing by adding GHGs to the atmosphere. “Ga [the atmospheric greenhouse effect] then represents the energy trapped by the entire atmospheric column between the surface and the top-of-the-atmosphere. The atmosphere then heats the surface by emitting absorbed energy back to the surface” (ibid., my italics). The causal sequence begins with warming of the troposphere, and ends with warming of the surface. ↩
- GWT reduces Earth’s climate to heat movement by radiation transfer, and so omits the convection, wind, and weather that actually make up the system. All of the actual mechanisms of climate are reduced by parameterization to their radiation effects in order that they can be handled by computer models. This reduction provides the maneuvering room required to exaggerate the threat of global warming to the point where it has captured global attention. Earth’s atmosphere is a horrendously complex system, and without simplification, climate science would be impossible. Good simplifications are precisely what is needed for climate science—although scientists generally recognize that it is very difficult to leave out only what does not much matter and include all that does. Scientists should be, and usually are, the first to warn that simplification is hazardous. This hazard looms large in the current global enchantment with the prophecy of global warming. ↩
- We can think of the surface where one’s skin meets the blanket: Heat will flow through the surface only if it is warmer on one side than on the other, and the rate will be proportional to the temperature difference between the two sides. When you first wrap the blanket around you, assuming that it has not been warmed up), it will feel as cold as the surrounding air. You begin to warm up only as the blanket warms up, and it warms up from your own body heat. The blanket slows down the flow of heat from your body; the trapped heat warms the blanket; the blanket then warms you. As we shall see, something similar happens with the atmosphere: Heat flowing from the surface layer is slowed down by the troposphere; the troposphere warms up; the troposphere then warms up the surface layer. ↩
- Of course, as soon as the center object warms up, this changes the heat flow some more, a complication that has been left out of this figure for simplicity’s sake. As soon as the center object warms up, this will slow its heat input and increase its heat output, thus warming its source and warming its sink as well. These effects have been left out in order to distinguish the two possibilities more clearly. ↩
- According to the IPCC, the globe has warmed by about 1ºC since 1750, due to GHGs added by human beings, which are now raising the temperature by about 0.2ºC per decade. (The rate of warming will be important in what follows.) ↩
- The IPCC says that since 1750, CO₂ levels have increased from 280 ppm to 379 ppm, which has increased the infrared reradiating down from the troposphere by 1.66 (± 0.17)W/m². Thus it is assumed that the troposphere has warmed. This in turn is supposed to have warmed the boundary layer by about 1ºC. ↩
- Lindzen (1999, 2007) provides a more theoretically elegant model of GWT, which is nevertheless quite intuitive. His model focuses on the reduction of transparency of the atmosphere to infrared radiation as a result of GHGs. The characteristic emission level (CEL), the altitude of one optical depth (in the infrared) of the atmosphere from above, is taken as the surface of interest for radiation balance. As far as infrared radiation is concerned, this level is the effective surface of the Earth, and its temperature is Earth’s effective emission temperature. Because GHGs make the troposphere less transparent, they raise the CEL (a doubling of CO₂ would raise it by about 50 m; Lindzen 1999, p. 104). Thus, the CEL is at a lower temperature than before, since temperature varies inversely with temperature. Because radiation intensity falls with temperature, outgoing infrared radiation is slowed at the CEL, while incoming solar radiation remains constant, resulting in global warming. Thus, the mechanism of the warming is still a slowing of outgoing infrared radiation by the troposphere (the altitude of the CEL varies with latitude and local conditions, but is usually near 500 hPa, or about 5.5 km). Eventually, the atmosphere will warm up until the temperature at the new higher CEL is virtually the same as it was at its lower altitude, causing tropospheric warming. ↩
- See, e.g., Gaffen et al. (2000); NRC (2000); NAS (2001); Lindzen and Giannitsis (2002); Lanzante et al. (2003, especially Fig. 4); Christy and Norris (2004); Seidel et al. (2004). ↩
- The passage continues as follows: “as well as its cautionary statement to the effect that temperature trends based on such short periods of record, with arbitrary start and end points, are not necessarily indicative of the long-term behavior of the climate system.” Since both the NRC and the NAS conclude that the measured trends are probably accurate, indeed that the possibility of their inaccuracy would be “difficult to reconcile with our current understanding,” I have removed it to make the conclusion of their analysis of GWT as concerns tropospheric warming perfectly clear, but include it here in the footnotes for its interest to scholars. It is important, however, to recognize that AR4 does indeed attack the data (AR4, pp. 267–271), and that this is its sole response to the problem identified by NAS and NRC. One cannot help but be struck, however, with the fact that despite IPCC’s reinterpretation of the data, their graphs of temperature change (Figure 3.17, p. 268 and Figure TS.7, p. 36) still show an increase in surface warming (0.5ºC from 1957 to 2005, or 0.1ºC/decade) which is greater than the increase in tropospheric warming (0.3ºC from 1957 to 2005, or 0.06ºC/decade)–leaving the problem as such untouched. So, even after reanalysis, surface temperatures are increasing faster than tropospheric temperatures (indeed, twice as fast) according to the IPCC itself (see also Figure 3.18, p. 269)–which contradicts GWT. Just as interesting (especially in light of the discussion in Chapters 5 and 6) is the fact that when it comes to the Technical Summary, where the case for GWT is summarized for policymakers with the intent of making them act on its conclusions, the warming trend over the last 50 years is said to be even larger (0.128ºC/decade, Figure TS.6, p. 37). As far as IPCC is concerned, the trend of surface warming is larger when it comes to policy than when it comes to its discrepancy with the lower trend of tropospheric warming. ↩
- The IPCC defines this as the 40º band over the equator, over which the bulk of solar radiation flux is absorbed by the Earth. ↩
- The crucial “surface minus lower troposphere” trends (USCCSP 2006, p. 13) show that GWT models predict on average that the troposphere will warm faster than the surface by about 0.07ºC/decade, whereas observations show that the surface is warming faster than the troposphere by about 0.05ºC/decade, just the opposite of what is predicted. ↩
- See especially Section 3.4.1, “Temperature of the Upper Air: Troposphere and Stratosphere” (AR4, pp. 265–271). ↩
- I am indebted to Lindzen (2007) for the logic of the following argument, although it uses USCCSP’s own data instead of Lee et al.’s (2007) data. ↩
- (USCCSP 2006, p. 13) and (AR4, pp. 265-271): ↩
- A little more precisely, the models’ 1979–1999 mean tropical warming trend for the troposphere is about 0.22ºC/decade, while their mean tropical warming trend for the surface is 0.15ºC/decade (USCCSP, p. 13). ↩
- Since the troposphere has been warming at about 0.09ºC/decade, the amount of surface warming that can be attributed to global warming itself is about 0.06ºC/decade. This figure is less than one-third of the warming predicted by GWT (0.20ºC/decade). ↩
- Here I am taking the very modest GWT prediction of a warming of 2.0ºC by 2100. The rate of temperature increase should also trend upward during the coming century, but not by much according to most models or according to most observations. ↩
- As this book goes to press (October 2008), news is gradually emerging from the ARGO project. This project is the first to provide information with sufficient range and accuracy to determine whether or not GWT is supported by changes in ocean temperature. By using hundreds of buoys that drift on ocean currents taking temperature (and other) readings at various depths and transmitting them by radio for collection by satellite, ARGO finally provides us a dataset of ocean temperatures that is both uniform in instrumentation and broad in scope both horizontally and vertically (http://www.argo.ucsd.edu/). Data that is accessible to the general public includes the following: “For the period since Argo achieved global coverage, 2004–2008, there is no significant trend in the globally averaged temperature” (http://argo3000.blogspot.com/2008/08/how-much-have-ocean-temperatures.html, 11 September, 2008, posted by Argo TC on 5 August, 2008). Some unofficial reports say that ocean temperatures are in fact slightly down (e.g., Gunter 2008), a fact hidden by the “no significant trend” rubric. Once again, this datum is both surprising and contrary to what GWT predicts. According to GWT, temperatures should be rising constantly for the oceans, just as they are predicted to do for the atmosphere. In fact, this is not happening. The response of GWT supporters to the fact that neither the oceans nor the atmosphere are currently warming has been to retreat to the natural variations plus human forcing model, which as we have seen above, renders GWT untestable (see Yes 2 and No 2, above). Unless natural variations are predicted, there is no way to tell which portion of the current temperature is due to human forcing, and we can only take it on faith that even though temperatures are falling, they would have been even lower without human forcing. In fact, GWT modelers claim to be able to predict natural variations through their multiple feedback models. However, these models predict a steady rise in temperature for both oceans and atmosphere. This is contradicted by the current data, which instead is in agreement with the absence of tropospheric warming just discussed. ↩